
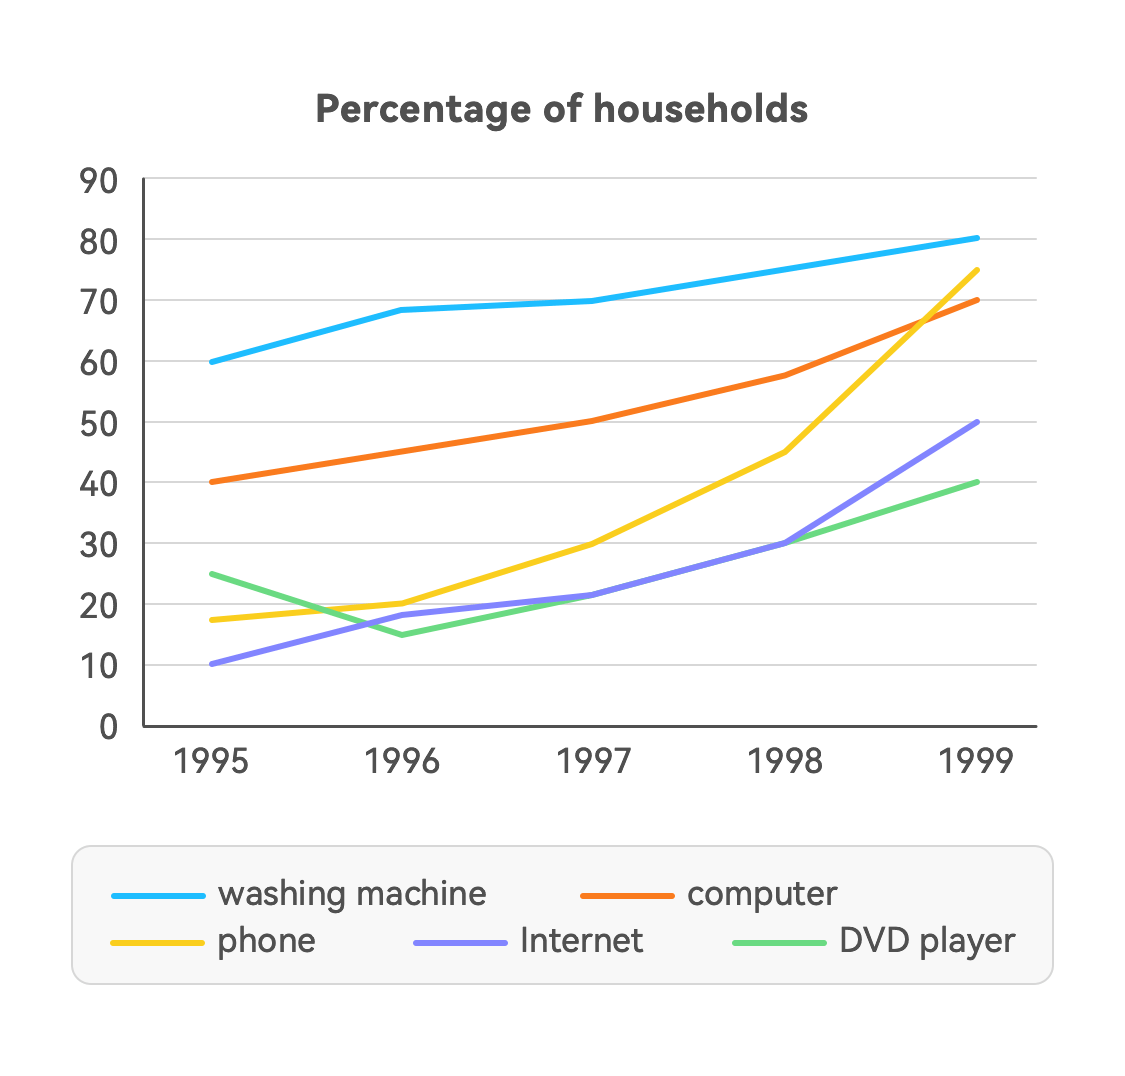
The line graph illustrates the proportion of households with various types of technology in the United States between 1995 and 1999, including washing machine, computer, phone, Internet, and DVD player. It is noticeable that there was a upward trend in five categorises over four years. Additionally, that of phone witnessed a significant increase from 1996 and 1998 and ranked second in 1999. In 1995, the proportion of washing machine came top of the list, following by computer, DVD player, phone, and Internet, respectively. Between 1996 and 1998, there was a moderate growth in all categories. DVD player saw an upturn trend with a bottom at 15% in 1996, then rising steeply to 40$ in 1999. However, spending on phone saw a significant rise by more than 50% from nearly 20% to 75%, that of Internet also experienced a similar trend. By the end, washing machine still at a lead with 80%, phone ranked second with 75%, then were computer, Internet and DVD player with 70%, 50%, and 40%, respectively.
รายละเอียดตัวอย่าง
The graph below shows the percentage of households with different kinds of technology in the U.S. from 1995 to 1999. Summarize the information by selecting and reporting the main features, and make comparisons where relevant. Write at least 150 words.
18/07/2026 09:09 6.0 คะแนน
หัวข้อ
The graph below shows the percentage of households with different kinds of technology in the U.S. from 1995 to 1999. Summarize the information by selecting and reporting the main features, and make comparisons where relevant. Write at least 150 words.
จำนวนคำ: 169
แผนภูมิ/กราฟ
Essay
คะแนนรวม
6.0±0.5
ดีพอใช้
คะแนนเกณฑ์การเขียน
TA6.0
CC6.0
LR6.0
GRA6.0
Task Achievement6.0
เป้าหมาย: 7.0
ข้อผิดพลาด:0
Coherence & Cohesion6.0
เป้าหมาย: 7.0
ข้อผิดพลาด:3
Lexical Resource6.0
เป้าหมาย: 7.0
ข้อผิดพลาด:4
Grammar & Accuracy6.0
เป้าหมาย: 7.0
ข้อผิดพลาด:0
คลิกข้อความที่ไฮไลต์ในเรียงความเพื่อดูคำแนะนำรายละเอียดเพื่อพัฒนา
การวิเคราะห์เชิงลึก
Task 1 - Academic Writing
4 tools available
บทความตัวอย่าง - IELTS Writing Task 1
ยังไม่มีบทความตัวอย่าง
กดปุ่มด้านล่างเพื่อวิเคราะห์และสร้างบทความตัวอย่างคุณภาพสูงสำหรับ Task 1