
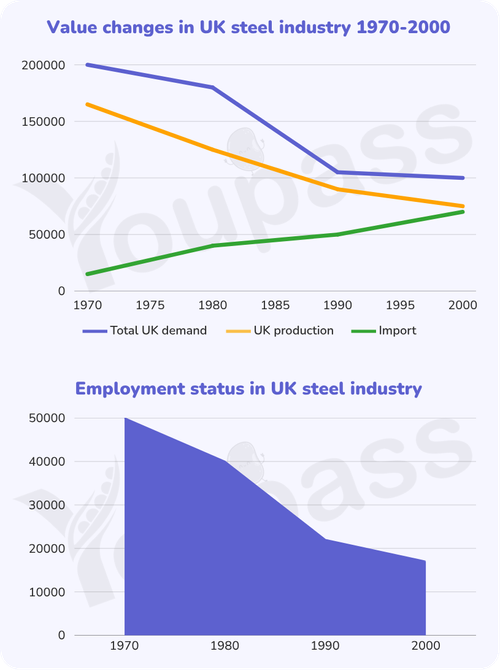
The two charts demonstrate the changes in value of steel in the UK and the employment status in this industry from 1970 to 2000. Overall, there has been an downward trend among the values of steel in three categories, except import. Although witnessed a noticeably drop, total UK demand remain the biggest categories. In the mean time, the employment rates in the UK steel industry tended to dropped dramatically. As regards the line graph, The total of UK demand was the dominant categories throughout the period, started with 200000 and dropped gradually to about 170000 before decreasing significantly to 100000 in 2000. Similarly but to a lesser extend, 150000 was the figure for UK production in 1970, this figure then decreased slightly to 80000 in 1990 and ended with 60000 production in 2000. In contrast, although in 1970, the figure for import category was only 10000 which increased gradually to 45000 before significantly rose to 50000 and reached its peak in 2000 with approximately 55000. Turning to the second graph, in 1970 there was about 50000 employments which was the highest figure throughout the period. After 10 years, this number dropped slightly to 40000 before witnessed a significant decreased to 20000 in 1990. Finally, there was a shortage in employment in the steel industry in the UK in 2000, with only around 18000 employments in this year.
รายละเอียดตัวอย่าง
The two line graphs show the changes in UK steel demand and employment in the steel industry between 1970 and 2000. Summarise the information by selecting and reporting the main features, and make comparisons where relevant.
18/07/2026 09:13 5.5 คะแนน
หัวข้อ
The two line graphs show the changes in UK steel demand and employment in the steel industry between 1970 and 2000. Summarise the information by selecting and reporting the main features, and make comparisons where relevant.
จำนวนคำ: 227
แผนภูมิ/กราฟ
Essay
คะแนนรวม
5.5±0.5
พื้นฐาน
คะแนนเกณฑ์การเขียน
TA5.0
CC6.0
LR6.0
GRA6.0
Task Achievement5.0
เป้าหมาย: 7.0
ข้อผิดพลาด:0
Coherence & Cohesion6.0
เป้าหมาย: 7.0
ข้อผิดพลาด:4
Lexical Resource6.0
เป้าหมาย: 7.0
ข้อผิดพลาด:5
Grammar & Accuracy6.0
เป้าหมาย: 7.0
ข้อผิดพลาด:0
คลิกข้อความที่ไฮไลต์ในเรียงความเพื่อดูคำแนะนำรายละเอียดเพื่อพัฒนา
การวิเคราะห์เชิงลึก
Task 1 - Academic Writing
4 tools available
บทความตัวอย่าง - IELTS Writing Task 1
ยังไม่มีบทความตัวอย่าง
กดปุ่มด้านล่างเพื่อวิเคราะห์และสร้างบทความตัวอย่างคุณภาพสูงสำหรับ Task 1