
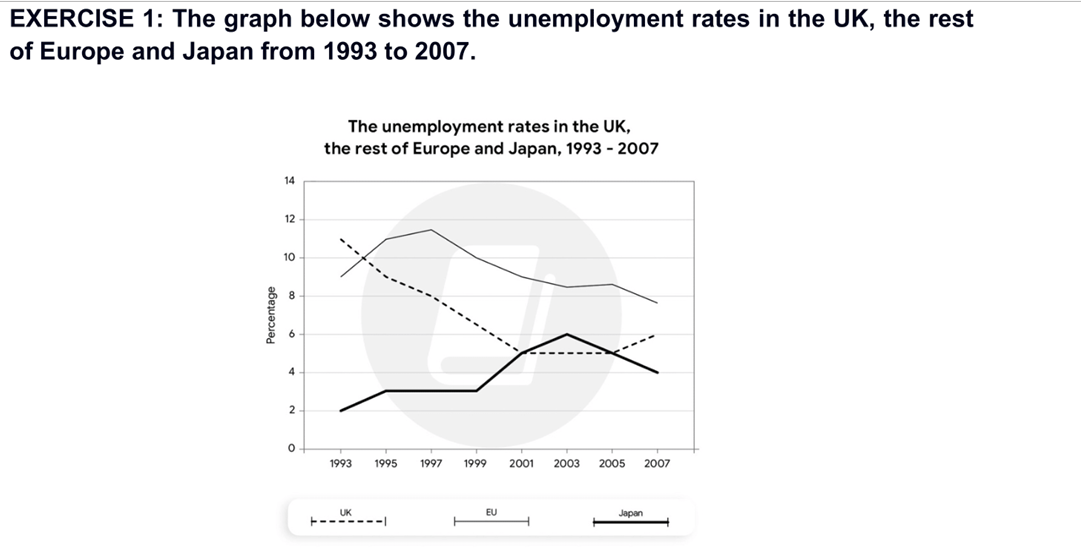
The graph depicts the changes in unemployment rates within the UK, the rest of Europe, and Japan during the 15-year period spanning from 1993 to 2007. Overall, it is apparent that the UK exhibited a downward trend in its unemployment rate throughout the years. In contrast, both the rest of Europe and Japan experienced fluctuations. The rest of Europe maintained a dominant position for most of the period, whereas Japan consistently recorded the lowest level of unemployment. In 1993, the UK had the highest rate, with around 11% of its workforce being jobless. However, it underwent a sharp fall, plunging to around 5% in 2001, and remained stable at this level, with a slight increase to 6% by the end the period. The rest of Europe witnessed an opposite pattern, starting at around 9% in 1993 and overtaking the UK in 1994. Having reached a peak of just under 12% in 1997, the level of unemployment then underwent a significant decline, dropping to just under 8% at the end of the period. Japan maintained the lowest level of unemployment over the period. Beginning with a mere 2% in 1993, the rate gradually increased, surpassing that of the UK in 2001. This upward trend continued, reaching a peak of 6% in 2003, before decreasing to 4% in 2007.
รายละเอียดตัวอย่าง
The graph below shows the unemployment rates in the UK, the rest of Europe and Japan from from 1993 to 2007.
18/07/2026 09:16 7.0 คะแนน
หัวข้อ
The graph below shows the unemployment rates in the UK, the rest of Europe and Japan from from 1993 to 2007.
จำนวนคำ: 217
แผนภูมิ/กราฟ
Essay
คะแนนรวม
7.0±0.5
ดีมาก
คะแนนเกณฑ์การเขียน
TA7.0
CC7.0
LR7.0
GRA7.0
Task Achievement7.0
เป้าหมาย: 7.0
ข้อผิดพลาด:0
Coherence & Cohesion7.0
เป้าหมาย: 7.0
ข้อผิดพลาด:2
Lexical Resource7.0
เป้าหมาย: 7.0
ข้อผิดพลาด:1
Grammar & Accuracy7.0
เป้าหมาย: 7.0
ข้อผิดพลาด:0
คลิกข้อความที่ไฮไลต์ในเรียงความเพื่อดูคำแนะนำรายละเอียดเพื่อพัฒนา
การวิเคราะห์เชิงลึก
Task 1 - Academic Writing
4 tools available
บทความตัวอย่าง - IELTS Writing Task 1
ยังไม่มีบทความตัวอย่าง
กดปุ่มด้านล่างเพื่อวิเคราะห์และสร้างบทความตัวอย่างคุณภาพสูงสำหรับ Task 1