
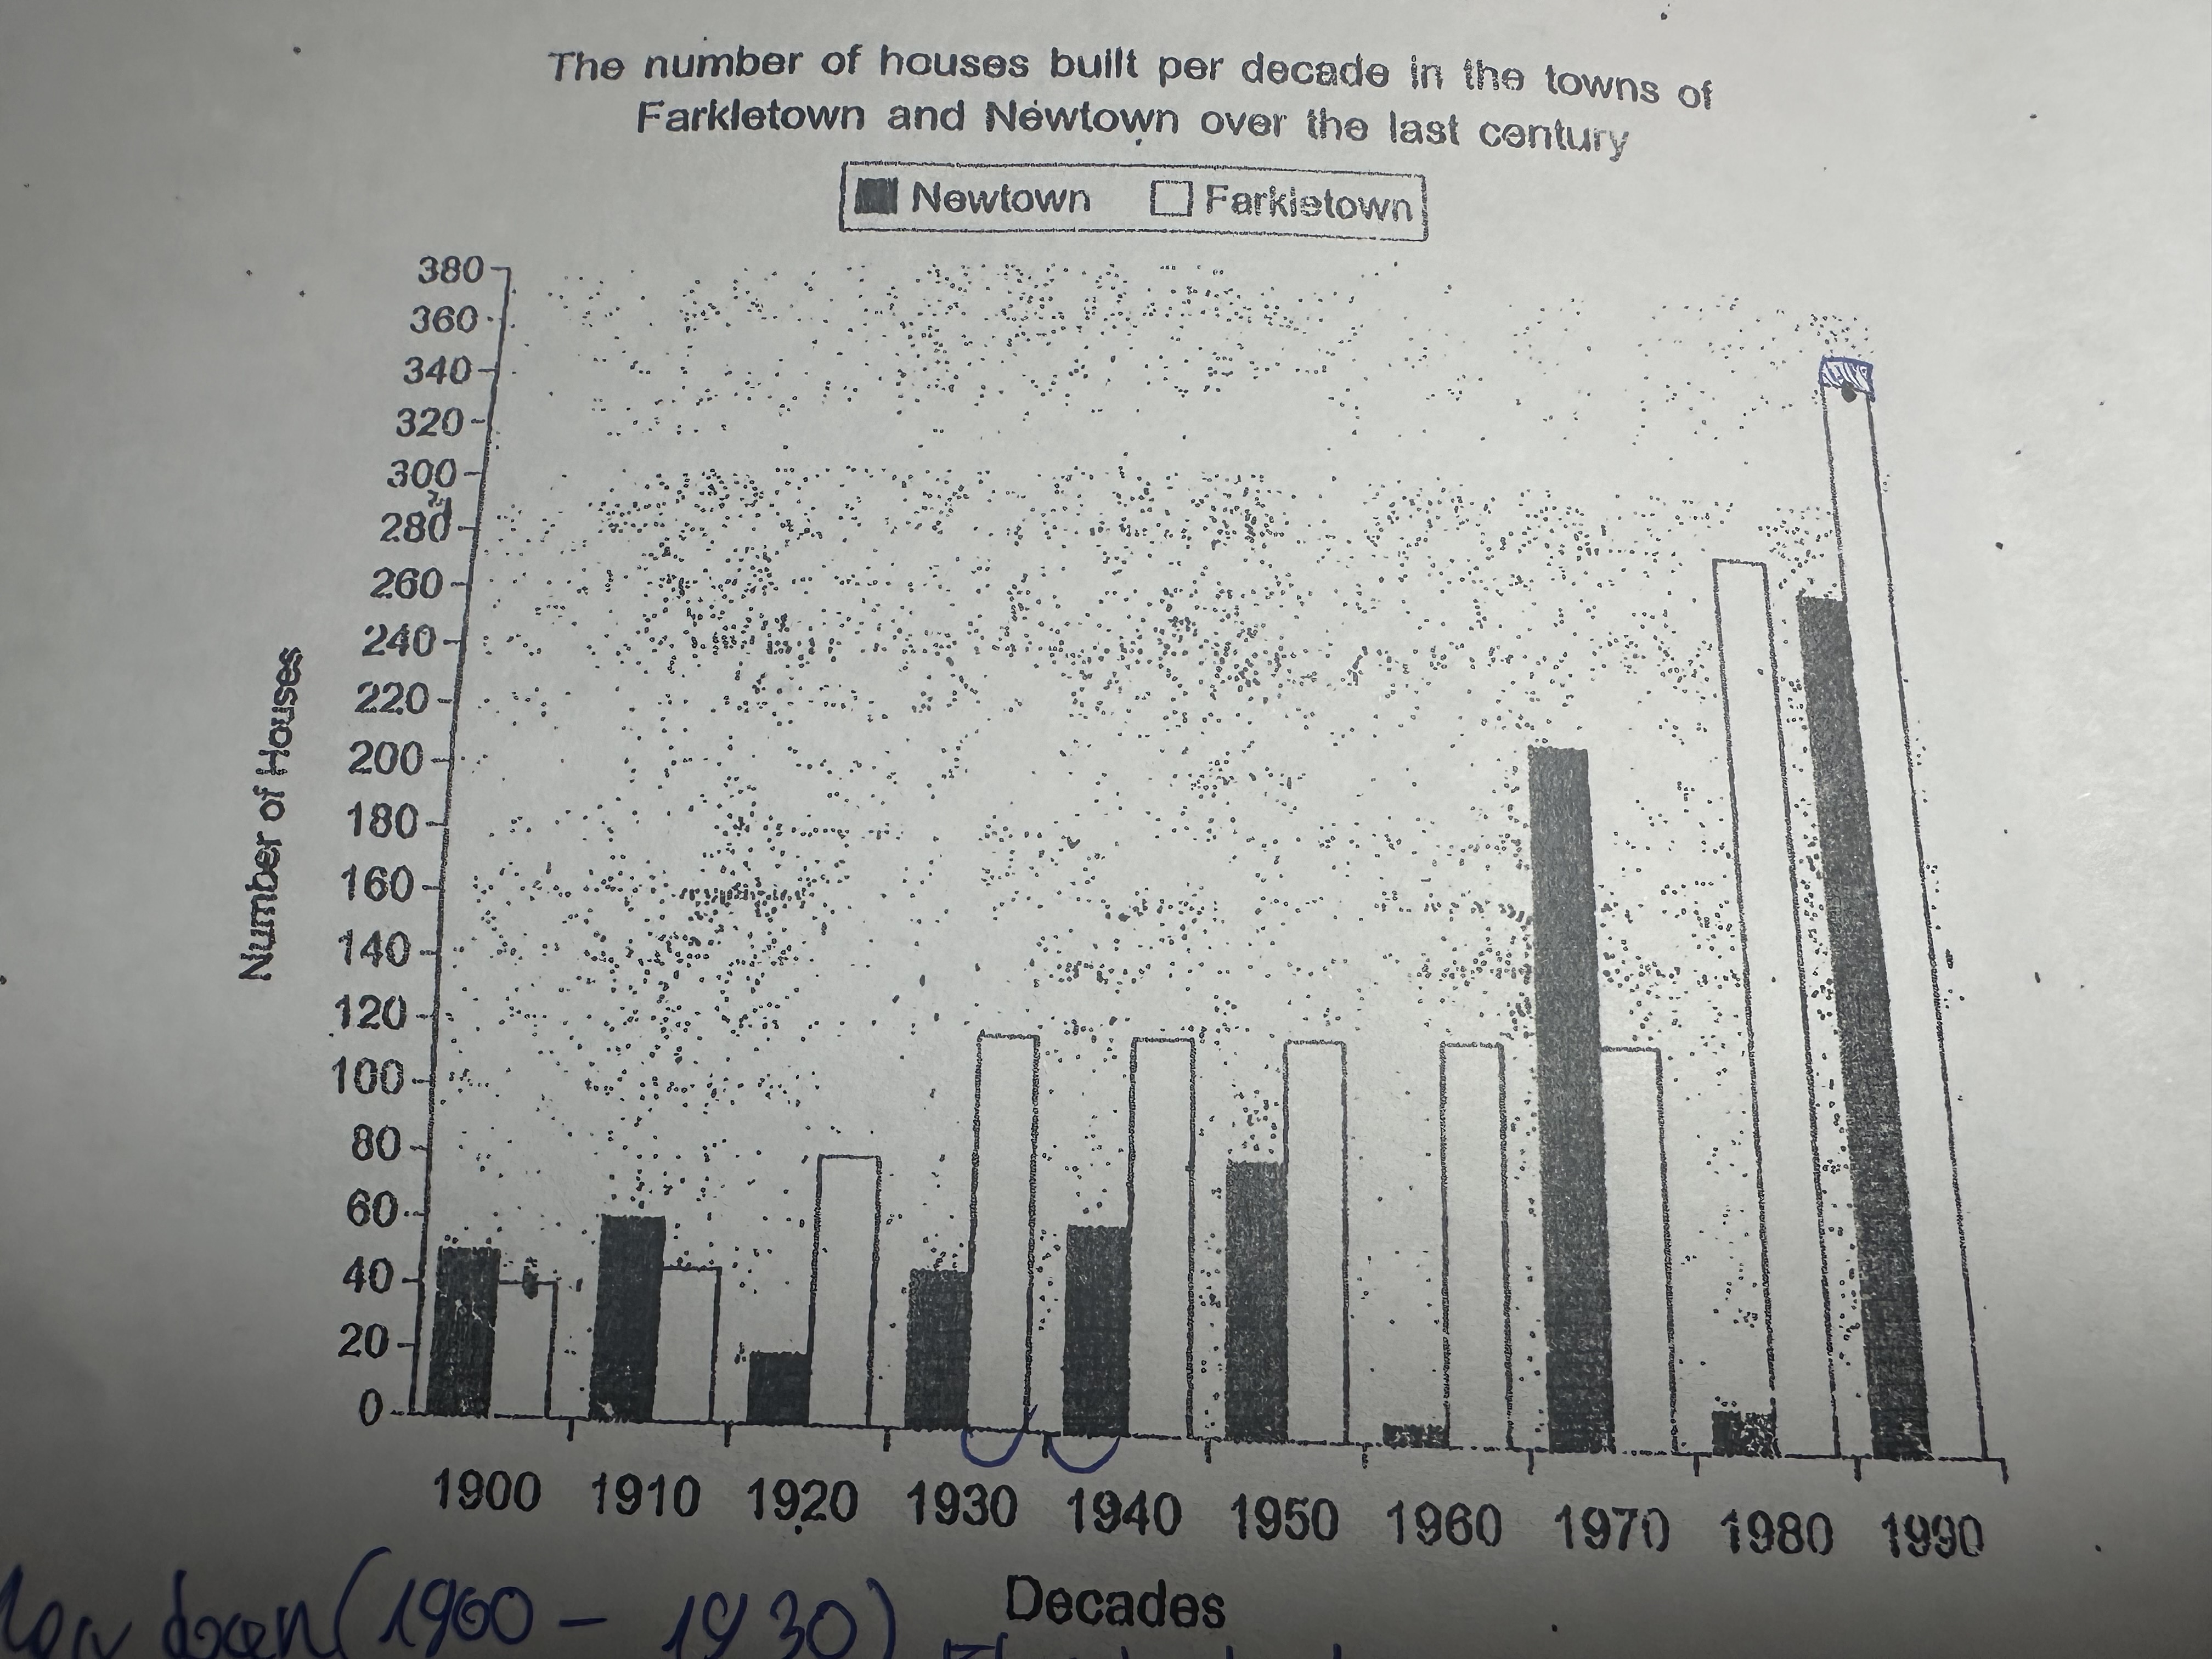
The bar chart illuminate the number of houses bult per decade in the town of farkletown and newtown over the span couse of 90 years, commecing starting from 1900 Overall, it is immediately apparent that newtown and farkletown experienced similar upswings over the specificed period. Though recorded the fastest growth. Another farkletown outstanding features is that farkletown generally surpassed newtown In the fist tow decades of century, more house were erected than in farkletown. Howerver, constructions diminished consisderably to only 20 houses. Over the subsequent three decades, the figure escalated steadily to 80 houses before falling to approximately 0 in the 1960s. This was followed by a soar to 220 houses in the 1970s. Apart from a slump to just 10 houses in 1980, the number experienced remarkable surge to 360 over the end or the period. Turning to farkletown, the figures rose steadily from40 houses in 1900 to nearly 120 in 1930. There was plateaused at 120 over the 4 decades. Followed by a rocketed to 360 by the end of the period.
Sample Detail
The bar chart below shows the number of houses built per decade in two neighbouring towns, farkletown and newtownn during the last century.
18/07/2026 09:29 5.0 points
Topic
The bar chart below shows the number of houses built per decade in two neighbouring towns, farkletown and newtownn during the last century.
Word count: 174
Chart/Graph
Essay
Overall Scores
5.0±0.5
Basic
Writing Criteria Scores
TA5.0
CC5.0
LR5.0
GRA5.0
Task Achievement5.0
Target: 7.0
Errors:2
Coherence & Cohesion5.0
Target: 7.0
Errors:1
Lexical Resource5.0
Target: 7.0
Errors:3
Grammar & Accuracy5.0
Target: 7.0
Errors:0
Click on any highlighted text in the essay to view detailed suggestions for improvement.
Deep Analysis
Task 1 - Academic Writing
4 tools available
Sample Essay - IELTS Writing Task 1
No sample essay
Click the button below to analyze and generate a high-quality sample essay for Task 1.