
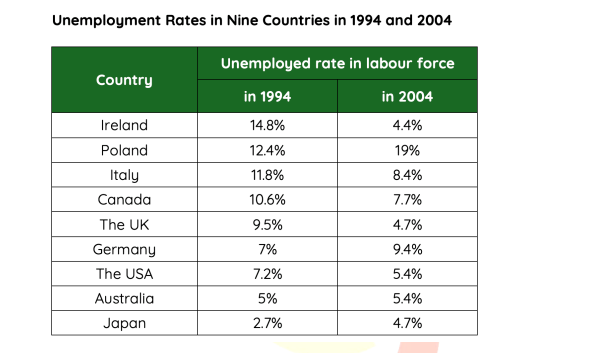
The table compares the unemployment rates in 9 countries in two separate years, namely 1994 and 2004. Overall, the proportion of unemployed for almost all countries decreased, while the remaining ones increased. Furthermore, the most significant increase can be observed in the figure for Poland, while the opposite was true for Ireland. Regarding the countries with the most different changes, despite starting at the highest figure of unemployment rate at 14.8% in 1994, Ireland then declined rapidly to only 4.4% in 2004, becoming the country with the lowest unemployment rate. In contrast, this figure for Poland stood at 12.4% initially, which then exhibited a sharp growth to 19% in the final year. However, Italy and Canada's figures began at 11.8% and 10.6% initially, respectively, these figures later dropped slightly to 8.4% and 7.7%, respectively, in 2004. Notably, the proportion of employed in the UK decreased nearly by half from 9.5% to 4.7% between 1994 and 2004. As for the remaining countries with witnessing the small changes. Germany's unemployment rate stood at 7% in 2004 before rising slowly to 9.4% in 2004. A similar pattern can be seen in the data for Australia and Japan. The former figure stood at 5% initially and then grew marginally to 5.4% at the end of the period, while the latter also increased to 4.7% from 2.7% over the same period. The USA's figure, on the other hand, started at 7.2% and further dropped to 5.4% in 2004.
รายละเอียดตัวอย่าง
The graph below shows the percentage of people unemployed in the total labour work force in 9 countries across 1994 and 2004.
18/07/2026 09:28 7.0 คะแนน
หัวข้อ
The graph below shows the percentage of people unemployed in the total labour work force in 9 countries across 1994 and 2004.
จำนวนคำ: 243
แผนภูมิ/กราฟ
Essay
คะแนนรวม
7.0±0.5
ดีมาก
คะแนนเกณฑ์การเขียน
TA7.0
CC7.0
LR7.0
GRA7.0
Task Achievement7.0
เป้าหมาย: 7.0
ข้อผิดพลาด:1
Coherence & Cohesion7.0
เป้าหมาย: 7.0
ข้อผิดพลาด:2
Lexical Resource7.0
เป้าหมาย: 7.0
ข้อผิดพลาด:3
Grammar & Accuracy7.0
เป้าหมาย: 7.0
ข้อผิดพลาด:0
คลิกข้อความที่ไฮไลต์ในเรียงความเพื่อดูคำแนะนำรายละเอียดเพื่อพัฒนา
การวิเคราะห์เชิงลึก
Task 1 - Academic Writing
4 tools available
บทความตัวอย่าง - IELTS Writing Task 1
ยังไม่มีบทความตัวอย่าง
กดปุ่มด้านล่างเพื่อวิเคราะห์และสร้างบทความตัวอย่างคุณภาพสูงสำหรับ Task 1