
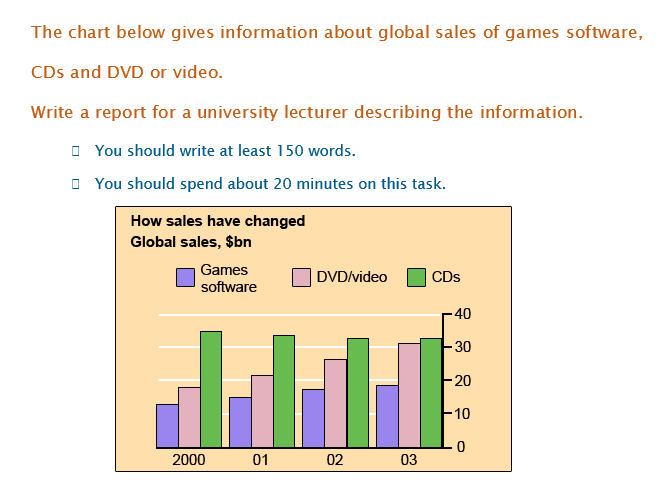
The bar chart given depicts the comparison of global sales of game software, CDs and DVD or video from 2000 to 2003. From an overall perspective, it is evident that the international sales of game software and DVD witnessed an upward trend, whereas a reverse pattern could be seen in the figure for CSs. In 2000, the sale value of CDs in the international market was highest, about $35 billion. This was followed by the data on DVD or video, approximately $18 billion. Games software, however, accounted for the lowest value, at just only $15 billion. By 2003, the international sales of CDs declined slightly to somewhere in the vicinity of $32 billion, yet it remained the most highest category.In contrast, the sales of DVDs or video in the global market saw a soar up to $31billion in 2003. Similarly, the period also witnessed a steady climb in the figure for games software, to approximately $19 billion at the end of the timeframe.
Sample Detail
The changes in the sales of games software,video material / DVDs
18/07/2026 09:37 6.5 points
Topic
The changes in the sales of games software,video material / DVDs
Word count: 163
Chart/Graph
Essay
Overall Scores
6.5±0.5
Fair
Writing Criteria Scores
TA7.0
CC7.0
LR6.0
GRA7.0
Task Achievement7.0
Target: 7.0
Errors:0
Coherence & Cohesion7.0
Target: 7.0
Errors:2
Lexical Resource6.0
Target: 7.0
Errors:4
Grammar & Accuracy7.0
Target: 7.0
Errors:0
Click on any highlighted text in the essay to view detailed suggestions for improvement.
Deep Analysis
Task 1 - Academic Writing
4 tools available
Sample Essay - IELTS Writing Task 1
No sample essay
Click the button below to analyze and generate a high-quality sample essay for Task 1.