
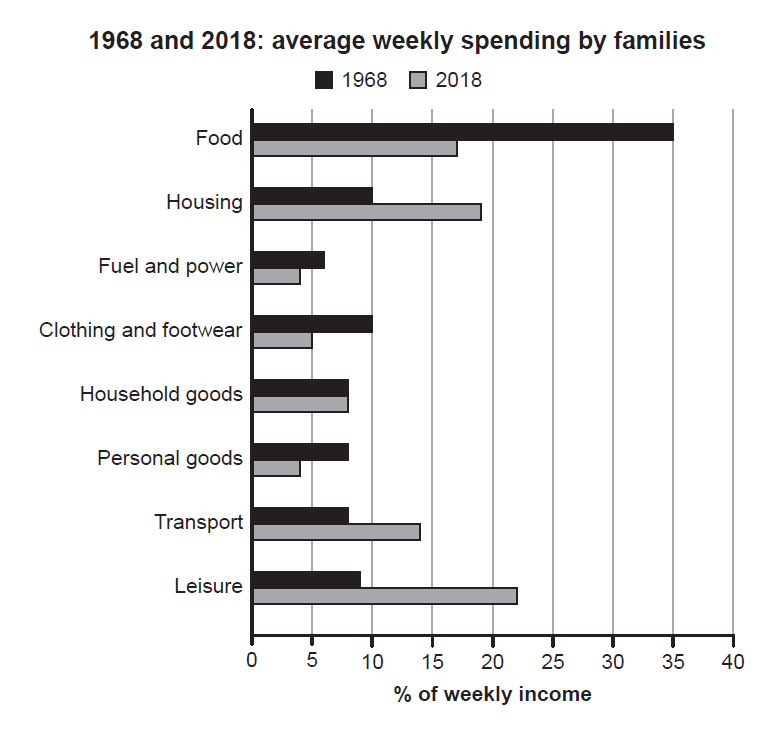
The bar chart illustrates percentage of weekly income was spent by families in one country during 1968 and 2018. Overall, it is clear that the figures of Food, Fuel and power, Fashion and Persional goods dropped, the proportion of House, Transport and leisure rosed, while only the percentages of Household goods remained unchanged. in 1968, Food recorded the highest figure, but in 2018 the proportion of leisure was the highest. In 1968, the proportion of Food recorded was the highest at 35%, followed with 10% by Clothing and footwear and 8% by Personal goods. By 2018, these figures decreased significantly to 17%, 5% and 4%. Furthermore, the percentage of Fuel and power was falled slightly from 6% to 4%. On the other hand, the figure of Housing and Transport rise moderatedly in 10% and 8% in 1968 to 19% and 14% in 2018. While the proportion of Leisure increased dramatically over 50 years since 1968. Although all the other figures changed, the percentage of Household good remained stable at 8%.
รายละเอียดตัวอย่าง
The chart below gives information about how families in one country spent their weekly income in 1968 and in 2018. Summarise the information by selecting and reporting the main features, and make comparisons where relevant.
18/07/2026 09:37 6.0 คะแนน
หัวข้อ
The chart below gives information about how families in one country spent their weekly income in 1968 and in 2018. Summarise the information by selecting and reporting the main features, and make comparisons where relevant.
จำนวนคำ: 170
แผนภูมิ/กราฟ
Essay
คะแนนรวม
6.0±0.5
ดีพอใช้
คะแนนเกณฑ์การเขียน
TA6.0
CC6.0
LR6.0
GRA6.0
Task Achievement6.0
เป้าหมาย: 7.0
ข้อผิดพลาด:0
Coherence & Cohesion6.0
เป้าหมาย: 7.0
ข้อผิดพลาด:2
Lexical Resource6.0
เป้าหมาย: 7.0
ข้อผิดพลาด:3
Grammar & Accuracy6.0
เป้าหมาย: 7.0
ข้อผิดพลาด:0
คลิกข้อความที่ไฮไลต์ในเรียงความเพื่อดูคำแนะนำรายละเอียดเพื่อพัฒนา
การวิเคราะห์เชิงลึก
Task 1 - Academic Writing
4 tools available
บทความตัวอย่าง - IELTS Writing Task 1
ยังไม่มีบทความตัวอย่าง
กดปุ่มด้านล่างเพื่อวิเคราะห์และสร้างบทความตัวอย่างคุณภาพสูงสำหรับ Task 1