
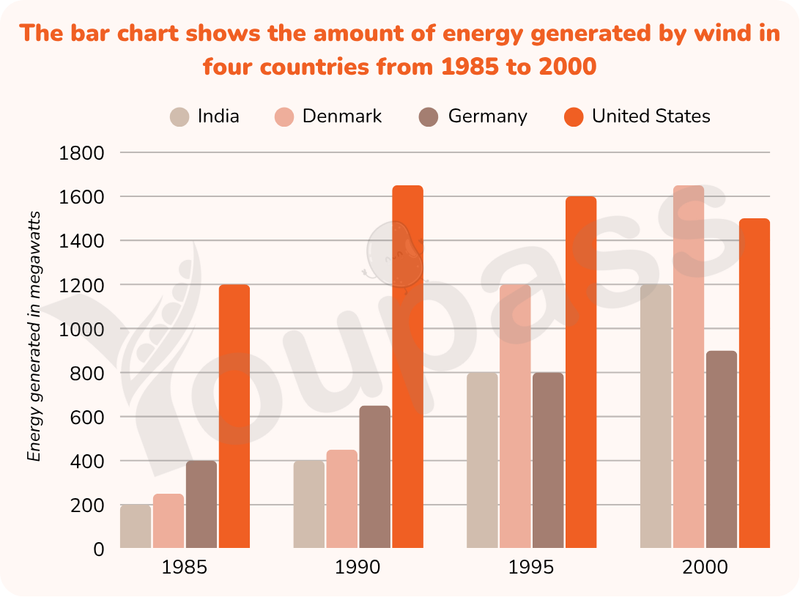
The graph compares the amount of energy generated by wind in four countries between 1985 and 2000, measured in megawatts. Overall, all of the nations followed an upward trend over the period, with the most significant increase observed in Denmark. Additionally, despite starting at the second-lowest position at first, Denmark surpassed the United States, which maintained the highest figure in most of the timeframe, to take the leading position by the end of the timescale, whereas India remained the lowest in most of the period. Looking at the countries with the higher figure, the energy generated by the United States was around 1200 megawatts, dominant compared to just about 230 of Denmark. In 1990, the amount of energy produced by United States grew substantially to its peak of 1630, before dropping gradually for the rest of the timeframe to just 1450 in 2000. Denmark underwent a more dramatic growth. The figure for Denmark rose sharply throughout the period, reaching roughly 1200 in 1995 and peaking about 1630 by the end of the timeframe. Regarding the remaining nations, both the countries experienced a steady increase during the timescale. In the initial year, the amount of energy produced by India and Germany were roughly 200 and 400 respectively. After that, they climbed considerably in the next 10 years, both reaching at approximately 800 megawatts in 1995. By the end of the period, while the amount of energy generated in India grew noticeably to around 1200 megawatts, that of Germany rose moderately to just 890 in 2000.
नमूना विवरण
The chart below shows the amount of energy generated from wind in four countries from 1985 to 2000. Summarize the information by selecting and reporting the main features and make comparisons where relevant.
18/07/2026 09:41 7.0 अंक
विषय
The chart below shows the amount of energy generated from wind in four countries from 1985 to 2000. Summarize the information by selecting and reporting the main features and make comparisons where relevant.
शब्दों की संख्या: 254
चार्ट/ग्राफ
Essay
समग्र स्कोर
7.0±0.5
अच्छा
राइटिंग मानदंड स्कोर
TA7.0
CC7.0
LR7.0
GRA7.0
Task Achievement7.0
लक्ष्य: 7.0
त्रुटियां:0
Coherence & Cohesion7.0
लक्ष्य: 7.0
त्रुटियां:2
Lexical Resource7.0
लक्ष्य: 7.0
त्रुटियां:3
Grammar & Accuracy7.0
लक्ष्य: 7.0
त्रुटियां:0
सुधार के विस्तृत सुझाव देखने के लिए लेख में किसी भी हाइलाइट किए गए टेक्स्ट पर क्लिक करें।
गहन विश्लेषण
Task 1 - Academic Writing
4 उपकरण उपलब्ध
नमूना लेख - IELTS Writing Task 1
कोई नमूना लेख नहीं
Task 1 के लिए उच्च-गुणवत्ता वाला नमूना लेख विश्लेषण और बनाने के लिए नीचे दिए गए बटन पर क्लिक करें।