
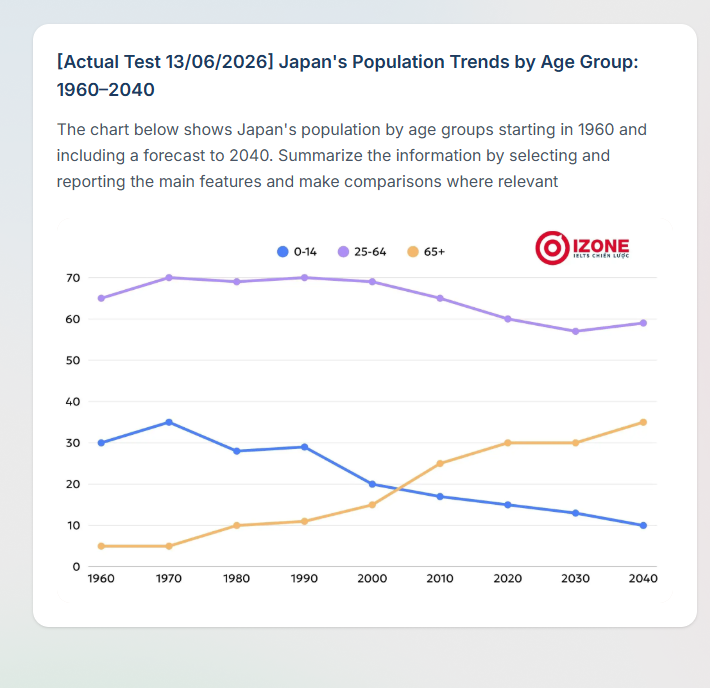
The given line graph illustrates Japan's population by 3 age groups, ranging from 0 to over 65 years old, beginning in 1960 and predicting in 2040. Overall, adult's number showed the highest number throughout the period. Meanwhile, the rate of teeanger stood out as the second highest, but becoming the lowest at the end of period caused by a dramatic decreasing. In contrast, old people' porpotion started as the lowest but increased strongly over time to overcome teeager at the end of period. Generally, the figure for adult witnessed a quite dropping over 80-year period. It beginned highly at around 65 percentage in 1960, then rose slightly to reach a peak at 70 in 1970. After that, it fluctuated a little bit around 70 percentage before falling gradually to under 60 in 2030 and ended up at approximately 60 in 2040. Regarding the two other ones, teenager's number fluctuated more. It started at 30 percentage in 1960, then rose to reach a peak at around 35 in 1970. After that climbing, it went down to just under 30 percentage in 1980 and stayed stable until 1990 when it experienced a significant decreasing period to end up at 10 in 2040. In contrast, old people's porpotion began moderately at only 5 percentage in 1960, then remain unchaged to 1970. After that, it rised gradually to reach a peak and end up at approximately 35 percentage, becoming the second highest.
Detail Sampel
The chart below shows Japan's population by age groups starting in 1960 and including a forecast to 2040. Summarize the information by selecting and reporting the main feature and make comparisions where relevant
18/07/2026 10:01 5.5 skor
Topik
The chart below shows Japan's population by age groups starting in 1960 and including a forecast to 2040. Summarize the information by selecting and reporting the main feature and make comparisions where relevant
Jumlah kata: 238
Grafik/Diagram
Essay
Skor Keseluruhan
5.5±0.5
Dasar
Skor Kriteria Writing
TA6.0
CC6.0
LR5.0
GRA5.0
Task Achievement6.0
Target: 7.0
Kesalahan:0
Coherence & Cohesion6.0
Target: 7.0
Kesalahan:2
Lexical Resource5.0
Target: 7.0
Kesalahan:6
Grammar & Accuracy5.0
Target: 7.0
Kesalahan:0
Klik teks yang ditandai di esai untuk melihat saran detail untuk peningkatan.
Analisis mendalam
Task 1 - Academic Writing
4 tools available
Esai contoh - IELTS Writing Task 1
Belum ada esai contoh
Silakan klik tombol di bawah untuk menganalisis dan membuat esai contoh berkualitas tinggi untuk Task 1.