
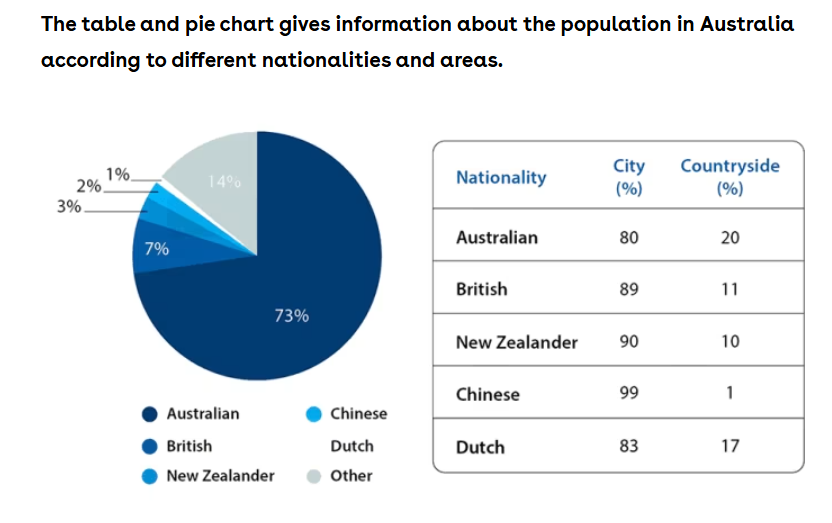
The given pie chart illustrates the percentage of different nationalities that made up Australia's population, while the bar chart compares their tendency to live in urban or rural areas Overall, the proportion of Australia’s native people dominates the pie chart, while British, New Zealander, Chinese and others accounted for the minority. Besides, most people in this country, irrespective of their nationality, tend to live in the city rather than in the countryside. According to the pie chart , Australians were the dominant group , making up 73% of the population, while, people from other nationalities accounted for 14%. In contrast, the figures of British, New Zealander, Chinese and Dutch people only about 7%, 3%, 2% and 1% respectively Turning to the table, people living in cities recorded the highest across all nationalities, whereas it's the dominant in China with 99%. Moreover, the figures of British, New Zealand and Dutch were ABOUT 89%, 90% and 83% respectively, while Australians had the lowest proportion living in urban areas , at only 80%. Although Australians accounted for the largest share of the population in the given pie chart , they recorded the smallest proportion of urban residents in the table
Detail Sampel
the table and pie chart gives information about the population in Australia according to different nationalities and areas.
18/07/2026 10:22 6.5 skor
Topik
the table and pie chart gives information about the population in Australia according to different nationalities and areas.
Jumlah kata: 197
Grafik/Diagram
Essay
Skor Keseluruhan
6.5±0.5
Cukup
Skor Kriteria Writing
TA7.0
CC7.0
LR7.0
GRA6.0
Task Achievement7.0
Target: 7.0
Kesalahan:0
Coherence & Cohesion7.0
Target: 7.0
Kesalahan:3
Lexical Resource7.0
Target: 7.0
Kesalahan:5
Grammar & Accuracy6.0
Target: 7.0
Kesalahan:0
Klik teks yang ditandai di esai untuk melihat saran detail untuk peningkatan.
Analisis mendalam
Task 1 - Academic Writing
4 tools available
Esai contoh - IELTS Writing Task 1
Belum ada esai contoh
Silakan klik tombol di bawah untuk menganalisis dan membuat esai contoh berkualitas tinggi untuk Task 1.