
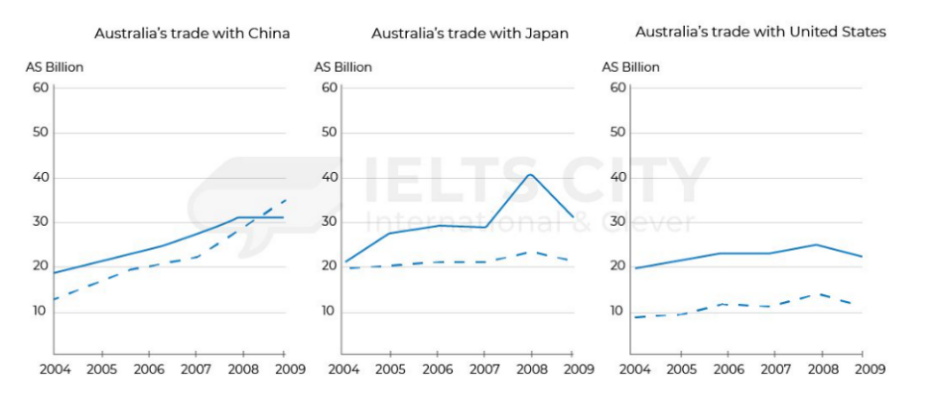
The given line charts illustrate how the value of Australia’s trades in three distinct nations namely China, Japan and the United States varied from 2004 to 2009. Overall, trades with all three countries experienced upward trends in which the figures for exports consistently outperformed those of imports. In addition, Australia’s exports and imports with China and Japan underwent substantial fluctuation, while trades with the US represented a relatively stable pattern. Regarding trades with China and Japan, the figure for exports with China showed a consistent growth throughout the period, initially stood at roughly 20 billion AUD in 2004, then rose gradually to reach its peak of above 30 billion AUD in 2008 before remaining unchanged at the end of the period. Meanwhile, the value of Australia’s imports with this nation represented a similar trajectory which was recorded at around 12 billion AUD at the beginning. After that, its figure increased significantly to roughly 35 billion AUD, and surpassed exports towards the end of the period. In addition, exports to Japan climbed sharply at about 20 billion AUD in 2004, then doubling to its peak of above 40 billion AUD in 2008 before failing to approximately 30 billion AUD by 2009. Meanwhile, imports from Japan fluctuated slightly at around 20 billion AUD between 2004 and 2009, ending the period near its starting point. Looking closely at trade with the United States, Australia’s trade with the US represented a considerably stable pattern compared with the other two nations. Exports edged up from around 20 billion AUD at the beginning to approximately 22 billion AUD in the final year. Similarly, imports remained consistently slow, fluctuating from around 8 to 13 billion AUD between 2004 and 2009.
নমুনা বিস্তারিত
The three line graphs show the value of Australia’s trade exported to and imports in three countries from 2004 to 2009
18/07/2026 10:56 7.0 স্কোর
টপিক বা বিষয়
The three line graphs show the value of Australia’s trade exported to and imports in three countries from 2004 to 2009
শব্দ সংখ্যা: 283
চার্ট/গ্রাফ
Essay
সামগ্রিক স্কোর
7.0±0.5
ভালো
রাইটিং মানদণ্ড স্কোর
TA7.0
CC7.0
LR7.0
GRA7.0
Task Achievement7.0
লক্ষ্যমাত্রা: 7.0
ভুল:0
Coherence & Cohesion7.0
লক্ষ্যমাত্রা: 7.0
ভুল:5
Lexical Resource7.0
লক্ষ্যমাত্রা: 7.0
ভুল:5
Grammar & Accuracy7.0
লক্ষ্যমাত্রা: 7.0
ভুল:0
উন্নতির জন্য বিস্তারিত পরামর্শ দেখতে প্রবন্ধের হাইলাইট করা যেকোনো লেখায় ক্লিক করুন।
গভীর বিশ্লেষণ
Task 1 - Academic Writing
4 tools available
নমুনা রচনা - IELTS Writing Task 1
কোনো নমুনা রচনা নেই
টাস্ক ১-এর জন্য উচ্চমানের নমুনা রচনা বিশ্লেষণ এবং তৈরি করতে নিচের বাটনে ক্লিক করুন।