
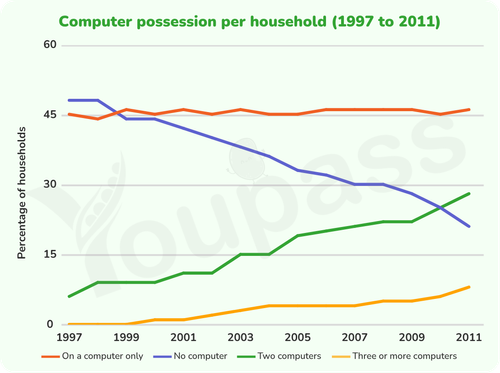
The graph illustrates the proportion of computer ownership per household in an European country from 1997 to 2011. Overall, the percentage of households without any computer showed an downward trend over the period. In addition, family owned only one computer was the most prevalent group throughout the period No family owned three or more computer in 1997 and 1999 , and then increased to 5% in 2004, before rose steadily and reach a peak at 10% in 2011. The figure for family that had two computers increased gradually from 1997 to 2003, and stood at 15% , before ending the period at 29% Households that had only a computer stood at 45%, 5% lower than that of family had no computer in 1997. However,the proportion of family owned no computer decreased to 30% in 2007 , before ending the period at only 20%. By contrast, the figure for family had only one computer almost unchanged , fluctuating at around 45% and 46% over the 8-year period
নমুনা বিস্তারিত
The graph below gives information about computer possession by household in one European country between 1997 and 2011. Summarise the information by selecting and reporting the main features, and make comparisons where relevant.
18/07/2026 10:57 6.0 স্কোর
টপিক বা বিষয়
The graph below gives information about computer possession by household in one European country between 1997 and 2011. Summarise the information by selecting and reporting the main features, and make comparisons where relevant.
শব্দ সংখ্যা: 166
চার্ট/গ্রাফ
Essay
সামগ্রিক স্কোর
6.0±0.5
মোটামুটি
রাইটিং মানদণ্ড স্কোর
TA6.0
CC6.0
LR6.0
GRA6.0
Task Achievement6.0
লক্ষ্যমাত্রা: 7.0
ভুল:0
Coherence & Cohesion6.0
লক্ষ্যমাত্রা: 7.0
ভুল:4
Lexical Resource6.0
লক্ষ্যমাত্রা: 7.0
ভুল:3
Grammar & Accuracy6.0
লক্ষ্যমাত্রা: 7.0
ভুল:0
উন্নতির জন্য বিস্তারিত পরামর্শ দেখতে প্রবন্ধের হাইলাইট করা যেকোনো লেখায় ক্লিক করুন।
গভীর বিশ্লেষণ
Task 1 - Academic Writing
4 tools available
নমুনা রচনা - IELTS Writing Task 1
কোনো নমুনা রচনা নেই
টাস্ক ১-এর জন্য উচ্চমানের নমুনা রচনা বিশ্লেষণ এবং তৈরি করতে নিচের বাটনে ক্লিক করুন।