
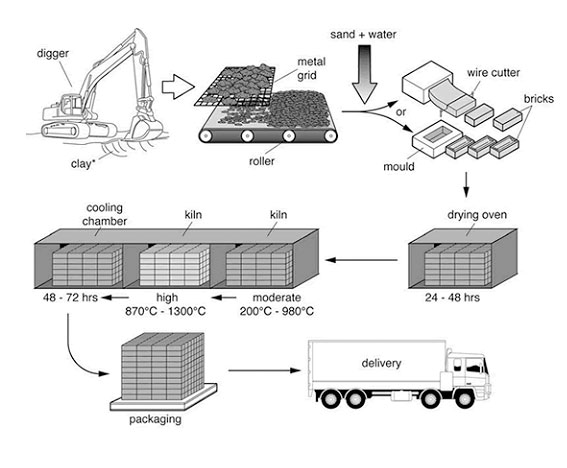
The flow chart illustrates how bricks are created. Overall, the flow chart shows how bricks are created in six simple steps. It illustrates how bricks are made. To begin with, clay in mud on the ground is collected by a digger. Secondly, they strain the clay they had collected before to a metal grid to strain out all the clay that is retained, and the clay after straining goes through several rollers with a mixture of sand and water. Before being finished bricks, they also go through a wire cutter or are put into a mould to cut and make a perfect shape for the bricks. After that, they put all the bricks into a drying oven with hot air for about 24 to 48 hours to make sure the bricks are perfect. Then they put all the bricks into the kiln at moderate degrees, from 200 degrees Celsius to 980 degrees Celsius and a bit hotter, about 870 degrees Celsius to 1300 degrees Celsius, then put them in the cooling chamber for 48 hours to 72 hours to make sure it cools down. Finally, when packing all the bricks has been done, they are put onto the delivery.
Sample Detail
the diagram shows how bbricks are maked. Write in 150 words
18/07/2026 14:29 6.0 points
Topic
the diagram shows how bbricks are maked. Write in 150 words
Word count: 199
Chart/Graph
Essay
Overall Scores
6.0±0.5
Fair
Writing Criteria Scores
TA6.0
CC6.0
LR6.0
GRA6.0
Task Achievement6.0
Target: 7.0
Errors:3
Coherence & Cohesion6.0
Target: 7.0
Errors:13
Lexical Resource6.0
Target: 7.0
Errors:10
Grammar & Accuracy6.0
Target: 7.0
Errors:0
Click on any highlighted text in the essay to view detailed suggestions for improvement.
Deep Analysis
Task 1 - Academic Writing
4 tools available
Sample Essay - IELTS Writing Task 1
No sample essay
Click the button below to analyze and generate a high-quality sample essay for Task 1.