
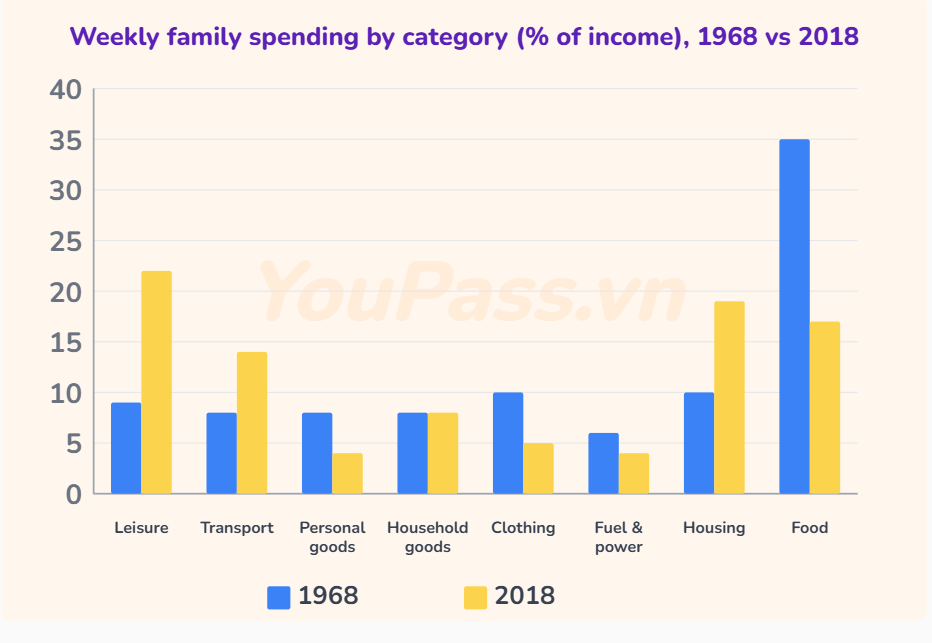
The line graph illustrates how households in a particular nation allocated their weekly income in 2 separate years: 1968 and 2018. Overall, while the expenditure on recreational activities, transportation, and housing witnessed an upward trend over the 50-year period, the share of other sectors, most notably food, declined significantly. Additionally, the figure for leisure exceeded that of food in 2018 and became the leading category in the end. Regarding the categories that experienced growth in their number, the trio of entertainment, transport, and housing accounted for the largest proportions in 1968, which oscillated between 8% and 10%. Until 2018, expenditure on leisure activities recorded the highest rise to 22%, becoming the largest spending category. Additionally, the costs of housing nearly doubled their initial share to reach 19% in the final year, whereas transportation documented a modest increase to 14%. As for the remaining categories, noticeably, food clearly dominated the household expenditure in 1968 at 35%, while the money spent on personal goods, clothing, and fuel each remained under the 10% mark However, in 2018, spending on food halved to just 17%; the other 3 sectors registered similar percentages , around 4-5%. Meanwhile, the expense of household goods remained steadily at 8% in both surveyed years.
รายละเอียดตัวอย่าง
The chart below gives information about how families in one country spent their weekly income in 1968 and in 2018. Summarise the information by selecting and reporting the main features, and make comparisons where relevant.
18/07/2026 14:52 6.5 คะแนน
หัวข้อ
The chart below gives information about how families in one country spent their weekly income in 1968 and in 2018. Summarise the information by selecting and reporting the main features, and make comparisons where relevant.
จำนวนคำ: 205
แผนภูมิ/กราฟ
Essay
คะแนนรวม
6.5±0.5
ดีพอใช้
คะแนนเกณฑ์การเขียน
TA7.0
CC7.0
LR6.0
GRA7.0
Task Achievement7.0
เป้าหมาย: 7.0
ข้อผิดพลาด:0
Coherence & Cohesion7.0
เป้าหมาย: 7.0
ข้อผิดพลาด:1
Lexical Resource6.0
เป้าหมาย: 7.0
ข้อผิดพลาด:3
Grammar & Accuracy7.0
เป้าหมาย: 7.0
ข้อผิดพลาด:0
คลิกข้อความที่ไฮไลต์ในเรียงความเพื่อดูคำแนะนำรายละเอียดเพื่อพัฒนา
การวิเคราะห์เชิงลึก
Task 1 - Academic Writing
4 tools available
บทความตัวอย่าง - IELTS Writing Task 1
ยังไม่มีบทความตัวอย่าง
กดปุ่มด้านล่างเพื่อวิเคราะห์และสร้างบทความตัวอย่างคุณภาพสูงสำหรับ Task 1