
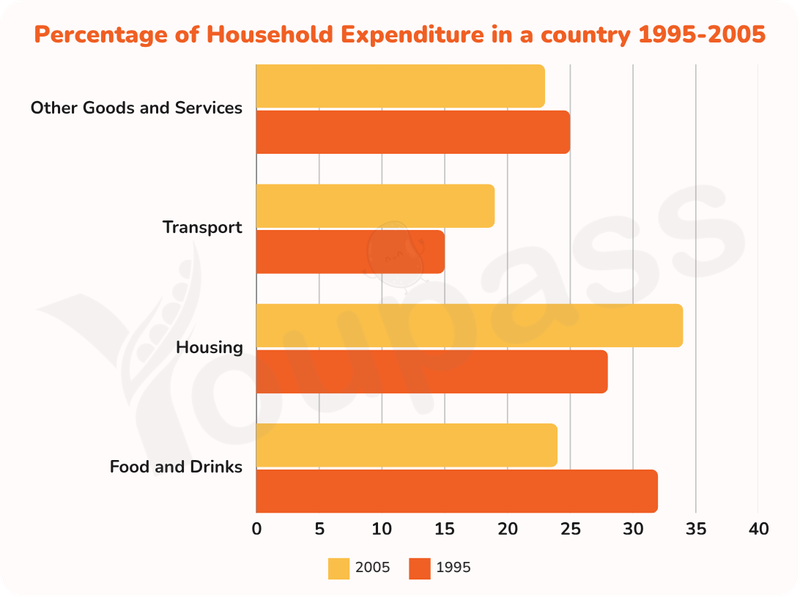
The bar chart illustrates the proportion of household expenses on goods and services in a country between 1995 and 2005 . Overall, foods and drinks dominated in 1995 while housing was ranked first in 2005. By contrast, transport was the lowest contributor in both 2005 and 1995. Taking a closer look at the figures in 1995, foods and drinks expense was the highest contributor, taking up to about 32%, followed by housing, which made up around 27%. Meanwhile, other goods and services accounted for roughly 25% , almost equal to housing, whereas, transport was the distant last, contributing only 15%. Turning to the remaining period, in2005, housing significantly climbed to approximately 34%, surpassing foods and drinks, which accounted for about 32%. On the other hand, other goods and services expenditures stayed relatively stable, showing a slight decrease to 23%, while transport, despite still being the lowest, showed a noticeably uptick to just under 20%.
नमूना विवरण
The chart shows the percentage of household expenditure on goods and services in a country from 1995 to 2005. Summarise the information by selecting and reporting the main features and make comparisons where relevant.
18/07/2026 14:59 6.5 अंक
विषय
The chart shows the percentage of household expenditure on goods and services in a country from 1995 to 2005. Summarise the information by selecting and reporting the main features and make comparisons where relevant.
शब्दों की संख्या: 154
चार्ट/ग्राफ
Essay
समग्र स्कोर
6.5±0.5
ठीक
राइटिंग मानदंड स्कोर
TA6.0
CC7.0
LR7.0
GRA6.0
Task Achievement6.0
लक्ष्य: 7.0
त्रुटियां:1
Coherence & Cohesion7.0
लक्ष्य: 7.0
त्रुटियां:1
Lexical Resource7.0
लक्ष्य: 7.0
त्रुटियां:3
Grammar & Accuracy6.0
लक्ष्य: 7.0
त्रुटियां:0
सुधार के विस्तृत सुझाव देखने के लिए लेख में किसी भी हाइलाइट किए गए टेक्स्ट पर क्लिक करें।
गहन विश्लेषण
Task 1 - Academic Writing
4 उपकरण उपलब्ध
नमूना लेख - IELTS Writing Task 1
कोई नमूना लेख नहीं
Task 1 के लिए उच्च-गुणवत्ता वाला नमूना लेख विश्लेषण और बनाने के लिए नीचे दिए गए बटन पर क्लिक करें।