
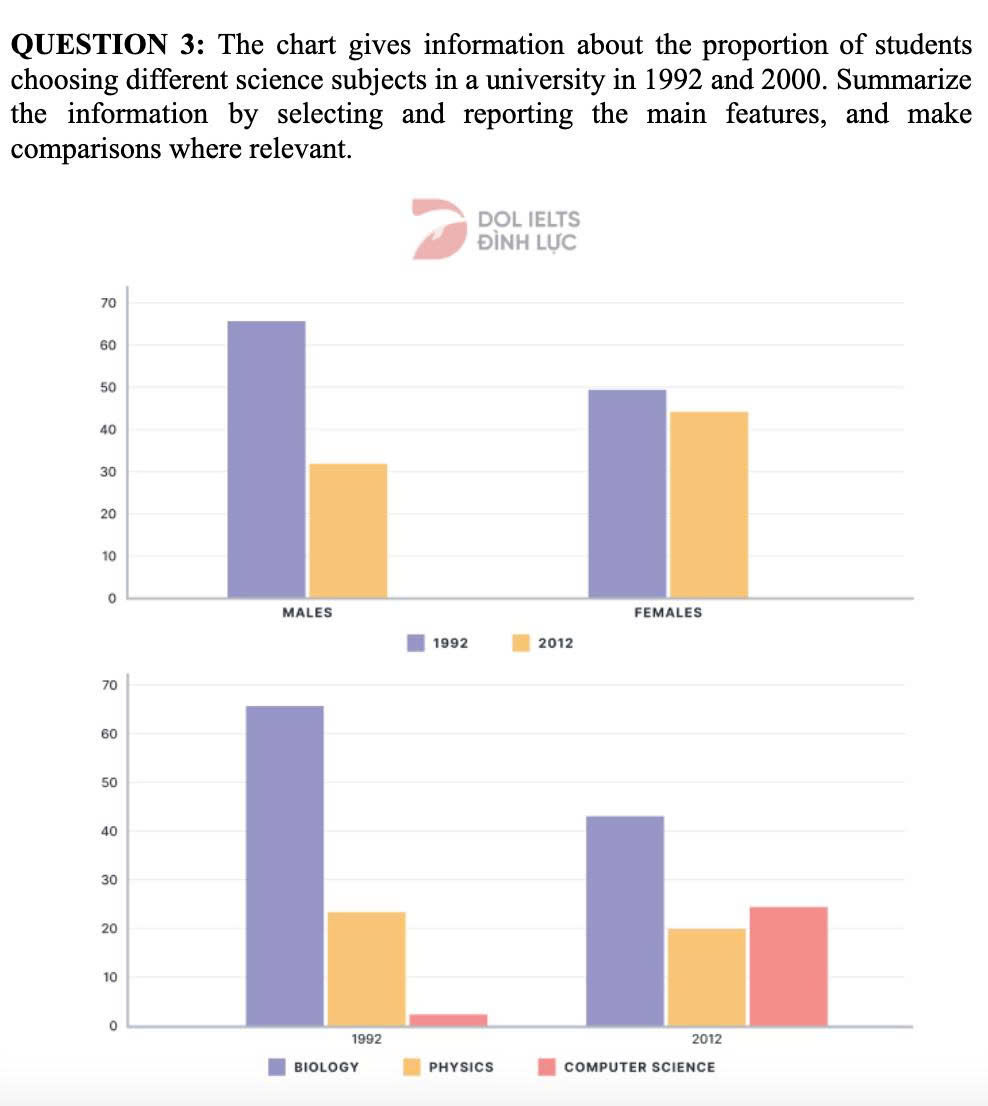
The two bar charts compare the percentage of students who selected various areas of science divided in a high education institution between 1992 and 2012. Overall, both genders of students concurrently witnessed declines, making it a substantial change in rank: The proportion for females selecting to learn science exceeded those in males in the past. Additionally, the figure for computer science rose dramatically, where biology was the most chosen subject throughout the period surveyed. Looking first at the proportion of students choosing to study science subjects, in 1992, there were 66% of men studying science compared to the percentage of women (stood at about 50%). However, the figure for male students selecting to learn science dropped significantly over a 20-year period, only 32% of them in 2012 chose science (approximately half of its initial figure). The proportion of female students who studied science in that university, even though it experienced a minor change, overtook the leading position of men to become the largest. Turning next to the three different science subjects, biology remained the most chosen area of science through the period despite a two-third of its falling in popularity, from 66% to 44% in 2002. A similar pattern but to a less extent was observed in physics, with 24% in 1992 decreased slightly to one-fifth in 2002. Conversely, computer science recorded the greatest growth in popularity, with its figure surged considerably for twelvefold from 2% to nearly 25% through the period, surpassing physics to become the second selected subject.
Detail Sampel
The chart gives information about the proportion of students choosing different science subjects in a university in 1992 and 2000.
18/07/2026 15:03 6.5 skor
Topik
The chart gives information about the proportion of students choosing different science subjects in a university in 1992 and 2000.
Jumlah kata: 250
Grafik/Diagram
Essay
Skor Keseluruhan
6.5±0.5
Cukup
Skor Kriteria Writing
TA6.0
CC7.0
LR7.0
GRA7.0
Task Achievement6.0
Target: 7.0
Kesalahan:1
Coherence & Cohesion7.0
Target: 7.0
Kesalahan:2
Lexical Resource7.0
Target: 7.0
Kesalahan:2
Grammar & Accuracy7.0
Target: 7.0
Kesalahan:0
Klik teks yang ditandai di esai untuk melihat saran detail untuk peningkatan.
Analisis mendalam
Task 1 - Academic Writing
4 tools available
Esai contoh - IELTS Writing Task 1
Belum ada esai contoh
Silakan klik tombol di bawah untuk menganalisis dan membuat esai contoh berkualitas tinggi untuk Task 1.