
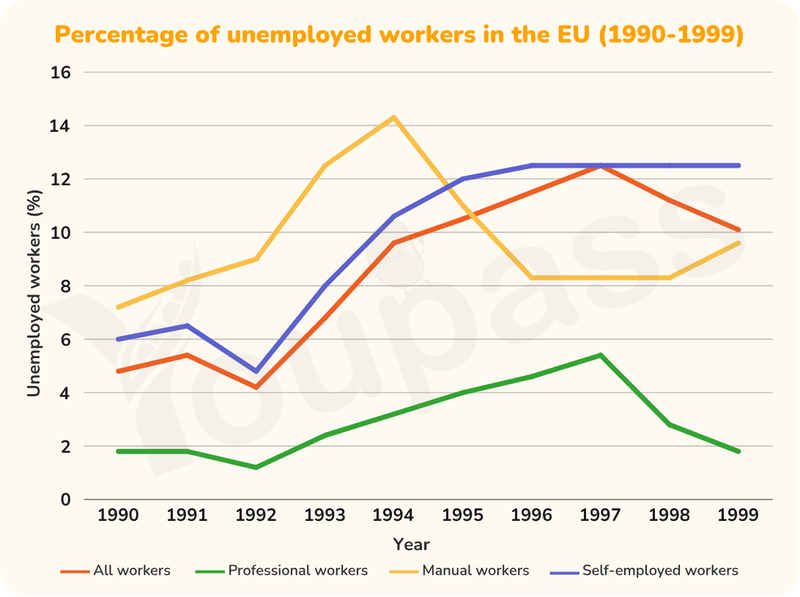
A deep analysis of the provided line chart reveals unemployment rates in three different categoriesin the Europe Union from 1990 to 1999. Overall, what stands out from the chart is that while the levels of joblessness in all workers, manual and self-employed workers witnessed an upward trend, that of professional workers remained unchanged . Another noticeable point is that proportion of profession who were unemployed was the lowest over the given period. As seen in the line chart, there was a similar pattern seen in all workers and self-employed workers, with there figures started at approximately 4.9% and 6%, respectively. Both of them reached the lowest point, which accounting for roughly 4.1% for all workers and 4.4% for self-employed workes in 1992. Subsequently, the rate of self-employed and all people without work throve gradually to almost the same at around 12.3% in 1997. However, while unemployment levels of self-employed workers virtually unchanged, that of all workers decreased dramatically to about 10% at the end of the period. Regarding professional workers, its rate of people without work began with the low figure at nearly 2%, the dropped slightly to just over 1% in 1992 before rebounding and peaked at roughly 5.2% in 1992. Professional employees, after that saw a significant fall to approximately nearly 2% again in 1999, remaining the less joblessness rate among four given categories. Manual workers exeperienced a fluctuation during the timeframe, starting at aroud 7.1%. Its unemployed percentage the rose rapidly and reached the highest point at about 14.% in 1994 before saw a dramatic fall to around 8.1% in 1996. This proportion almost unchaged until 1998 before increased to roughly 8.8% at the end of the period shown.
รายละเอียดตัวอย่าง
The graph below compares the percentage of unemployed workers in the European Union (all workers) with the percentages in the three categories, Professional, Manual and Self-employed. Summarise the information by selecting and reporting the main features, and make comparisons where relevant.
18/07/2026 15:06 6.0 คะแนน
หัวข้อ
The graph below compares the percentage of unemployed workers in the European Union (all workers) with the percentages in the three categories, Professional, Manual and Self-employed. Summarise the information by selecting and reporting the main features, and make comparisons where relevant.
จำนวนคำ: 282
แผนภูมิ/กราฟ
Essay
คะแนนรวม
6.0±0.5
ดีพอใช้
คะแนนเกณฑ์การเขียน
TA6.0
CC6.0
LR6.0
GRA6.0
Task Achievement6.0
เป้าหมาย: 7.0
ข้อผิดพลาด:0
Coherence & Cohesion6.0
เป้าหมาย: 7.0
ข้อผิดพลาด:1
Lexical Resource6.0
เป้าหมาย: 7.0
ข้อผิดพลาด:4
Grammar & Accuracy6.0
เป้าหมาย: 7.0
ข้อผิดพลาด:0
คลิกข้อความที่ไฮไลต์ในเรียงความเพื่อดูคำแนะนำรายละเอียดเพื่อพัฒนา
การวิเคราะห์เชิงลึก
Task 1 - Academic Writing
4 tools available
บทความตัวอย่าง - IELTS Writing Task 1
ยังไม่มีบทความตัวอย่าง
กดปุ่มด้านล่างเพื่อวิเคราะห์และสร้างบทความตัวอย่างคุณภาพสูงสำหรับ Task 1