
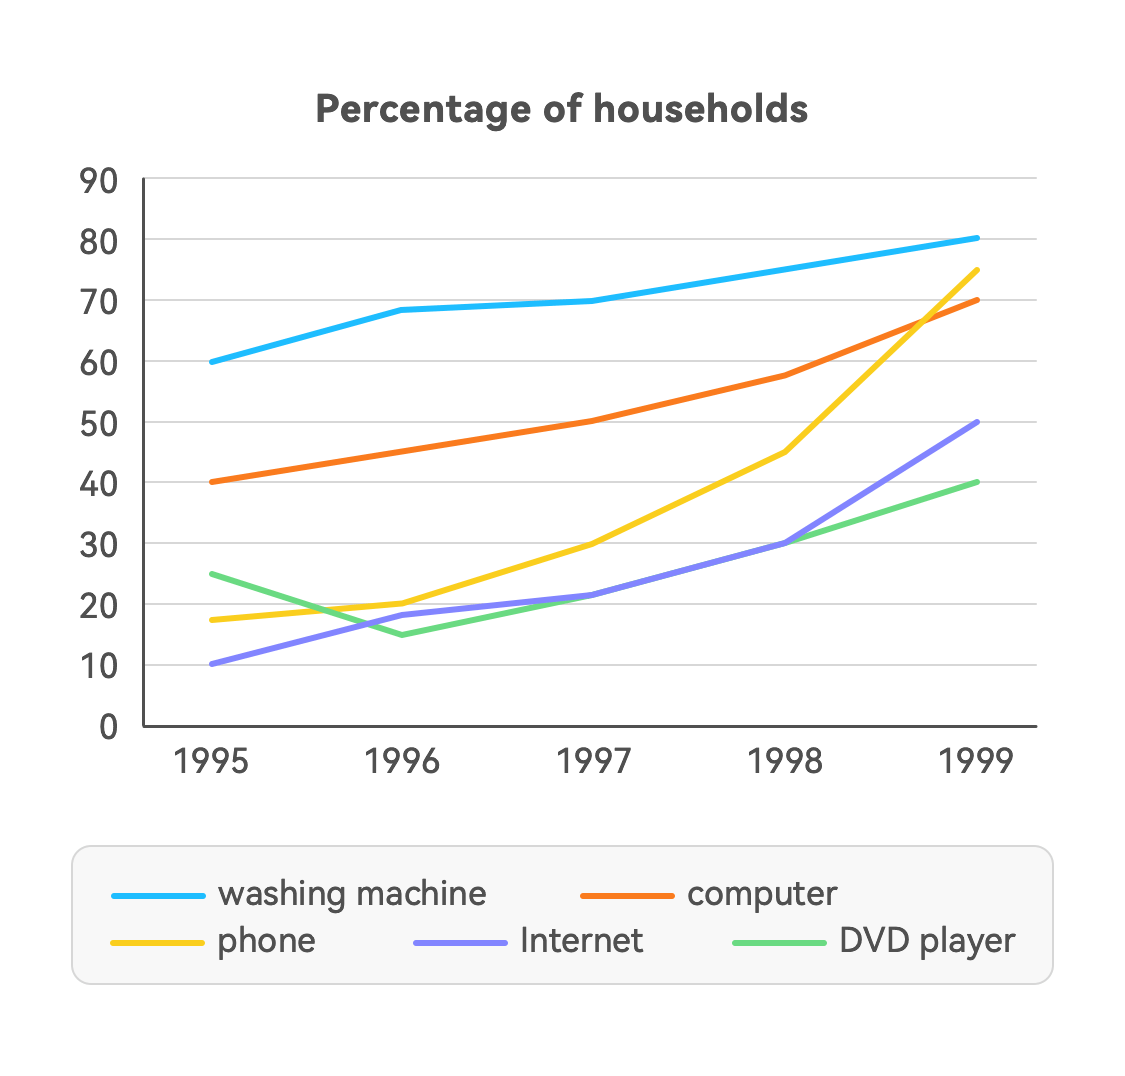
The line graph illustrates the proportion of households with five different kinds of smart devices in America over a period of 4-year, starting from 1995. It is clear that while washine machine represented as the highest figure, the opposite was true for DVD player. Notably, phone had the fastest growth among four remaining kinds of technology. As can be seen from the graph , washing machine began at 60% in 1995, which was much higher than that of DVD player, only nearly 25%. Moreover, these two figures experienced an opposite pattern. While the proportion of washing machine increased slightly to nearly 70%, that of DVD player declined sharply and reached the lowest point at around 17% in 1996. However, the figure for DVD player started rising up steadily and reached the highest point in the end of period , following the same pattern as that of washing machine in 1999, 40% and 80%, respectively. Lookng at the graph in more detail, three remaining figures all rose up slowly over the stage. Notably, phone witnessed the most significant growth, which coincided the proportion of computer at nearly 65% between 1998 and 1999. In addition, all three devices grew up in the end of period. While phone peaked at around 75%, Internet and computer were much lower, at 40% and 70% respectively.
รายละเอียดตัวอย่าง
The graph below shows the percentage of households with different kinds of technology in the U.S. from 1995 to 1999. Summarize the information by selecting and reporting the main features, and make comparisons where relevant. Write at least 150 words.
18/07/2026 15:18 5.0 คะแนน
หัวข้อ
The graph below shows the percentage of households with different kinds of technology in the U.S. from 1995 to 1999. Summarize the information by selecting and reporting the main features, and make comparisons where relevant. Write at least 150 words.
จำนวนคำ: 220
แผนภูมิ/กราฟ
Essay
คะแนนรวม
5.0±0.5
พื้นฐาน
คะแนนเกณฑ์การเขียน
TA5.0
CC6.0
LR5.0
GRA5.0
Task Achievement5.0
เป้าหมาย: 7.0
ข้อผิดพลาด:0
Coherence & Cohesion6.0
เป้าหมาย: 7.0
ข้อผิดพลาด:2
Lexical Resource5.0
เป้าหมาย: 7.0
ข้อผิดพลาด:4
Grammar & Accuracy5.0
เป้าหมาย: 7.0
ข้อผิดพลาด:0
คลิกข้อความที่ไฮไลต์ในเรียงความเพื่อดูคำแนะนำรายละเอียดเพื่อพัฒนา
การวิเคราะห์เชิงลึก
Task 1 - Academic Writing
4 tools available
บทความตัวอย่าง - IELTS Writing Task 1
ยังไม่มีบทความตัวอย่าง
กดปุ่มด้านล่างเพื่อวิเคราะห์และสร้างบทความตัวอย่างคุณภาพสูงสำหรับ Task 1