
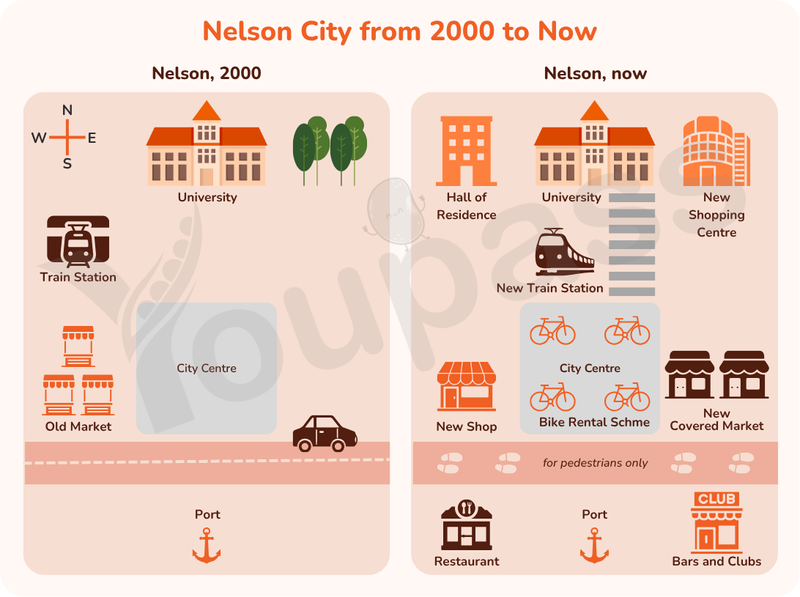
The given images illustrated some significantly differences that a city center named Nelson city has undergone untill the year 2000 to now. Overall, Nelson city has had much more development during the period. Some natural features have been removed, a hall for residents has been constructed, the routes have been level up, and a considerable number of infrastructures has been built up such as shopping center, new market, restaurant, and some other entertaining targeted constructions. In 2000, the Nelson city area was quite deserted with simple routes and few of buildings. There was a big university on the north side of the map. with a few natural features located right next to the right of the building. A train station was added on the west side, right above a complex of southwest located old markets. There was also a wide space for city centre. There was a road below playing a role in separating between the living area and a port. Moving to the present days, the Nelson city has changed significantly with more modern infrastructures. At the northwest corner of the map, there is a hall for residents of the Nelson city. At the right top corner, a shopping centre has been constructed newly. There are also some new covered market being opposite the shopping centre. At present Nelson city, the port now being between a restaurant and a complex of bars and clubs, while still remaining its position from the past. The train station and old markets have been modernized and upgraded into new ones. The road has become a path for pedestrians. In addition, there is a way for transporting from the city centre to the university, with a bike rental scheme provided for everyone.
Detail Sampel
The maps showed the changes in a city centre from the year 2000 to the present day. Summarise the information by selecting and reporting the main features, and make comparisons where relevant.
18/07/2026 15:19 6.0 skor
Topik
The maps showed the changes in a city centre from the year 2000 to the present day. Summarise the information by selecting and reporting the main features, and make comparisons where relevant.
Jumlah kata: 288
Grafik/Diagram
Essay
Skor Keseluruhan
6.0±0.5
Cukup
Skor Kriteria Writing
TA6.0
CC7.0
LR6.0
GRA6.0
Task Achievement6.0
Target: 7.0
Kesalahan:0
Coherence & Cohesion7.0
Target: 7.0
Kesalahan:1
Lexical Resource6.0
Target: 7.0
Kesalahan:4
Grammar & Accuracy6.0
Target: 7.0
Kesalahan:0
Klik teks yang ditandai di esai untuk melihat saran detail untuk peningkatan.
Analisis mendalam
Task 1 - Academic Writing
4 tools available
Esai contoh - IELTS Writing Task 1
Belum ada esai contoh
Silakan klik tombol di bawah untuk menganalisis dan membuat esai contoh berkualitas tinggi untuk Task 1.