
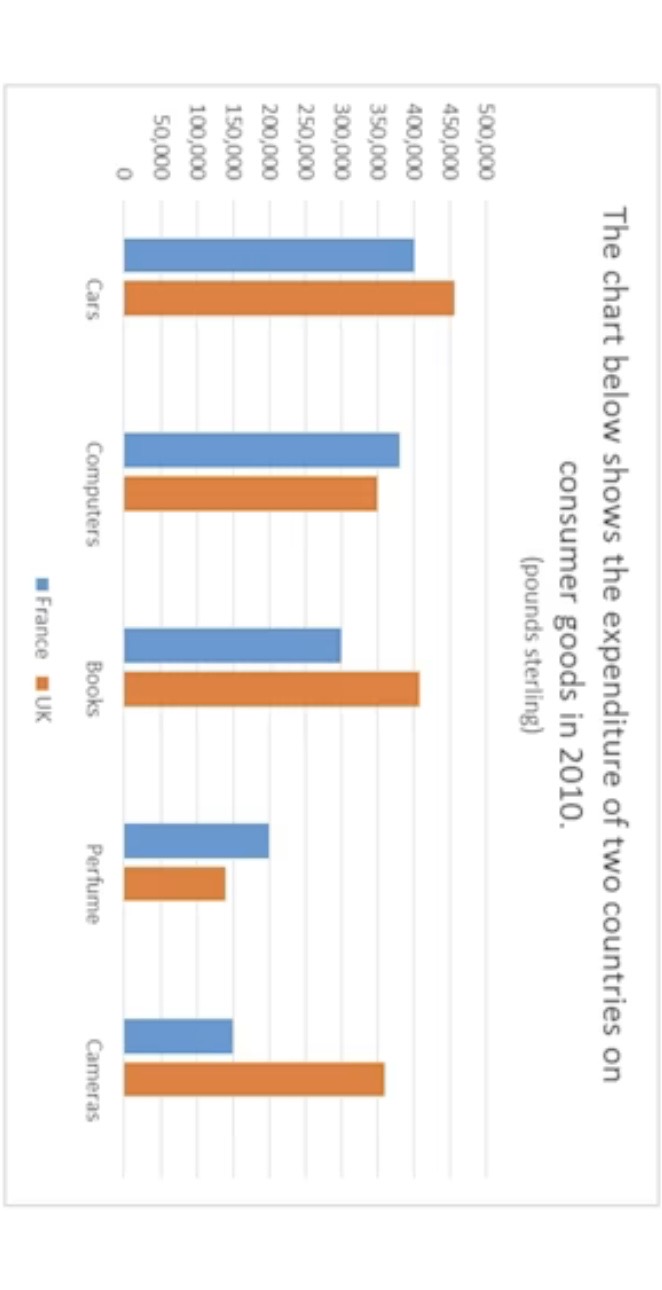
The bar chart provides information on five different areas of France and the UK in 2010. Overall, it is clear that the UK spent more money on cars, books and cameras than the other, while France did so on the two categories, computers and perfume. This difference show that both these nations used automobiles, and the biggest gap in expenditure was recorded in Camera. In 2010, more money was spent by France on Cars, Books and Camera. On the former category, France just spent 400,000 pounds, whereas the UK spent about 50,000 more. For Books, the budget gap widened, but both countries expend less than on Cars, approximately 380,000 and 400,000 pounds. The biggest disparity of two nation is cameras’ areas. The expenditure of cameras in France amounted 150,000, nearly a half of this category in the UK. However, in two distinct areas: computers and perfume, France invested even more. Roughly 400,000 pounds was spent by France on computers. The UK closed behind at around 350,000 pounds.Government investment in perfume both lower than another figure just about 200,000 and 150,000 pounds.
รายละเอียดตัวอย่าง
The chart below shows the expenditure of two countries on consumer goods in 2010
18/07/2026 15:23 5.0 คะแนน
หัวข้อ
The chart below shows the expenditure of two countries on consumer goods in 2010
จำนวนคำ: 181
แผนภูมิ/กราฟ
Essay
คะแนนรวม
5.0±0.5
พื้นฐาน
คะแนนเกณฑ์การเขียน
TA5.0
CC5.0
LR5.0
GRA5.0
Task Achievement5.0
เป้าหมาย: 7.0
ข้อผิดพลาด:1
Coherence & Cohesion5.0
เป้าหมาย: 7.0
ข้อผิดพลาด:3
Lexical Resource5.0
เป้าหมาย: 7.0
ข้อผิดพลาด:4
Grammar & Accuracy5.0
เป้าหมาย: 7.0
ข้อผิดพลาด:0
คลิกข้อความที่ไฮไลต์ในเรียงความเพื่อดูคำแนะนำรายละเอียดเพื่อพัฒนา
การวิเคราะห์เชิงลึก
Task 1 - Academic Writing
4 tools available
บทความตัวอย่าง - IELTS Writing Task 1
ยังไม่มีบทความตัวอย่าง
กดปุ่มด้านล่างเพื่อวิเคราะห์และสร้างบทความตัวอย่างคุณภาพสูงสำหรับ Task 1