
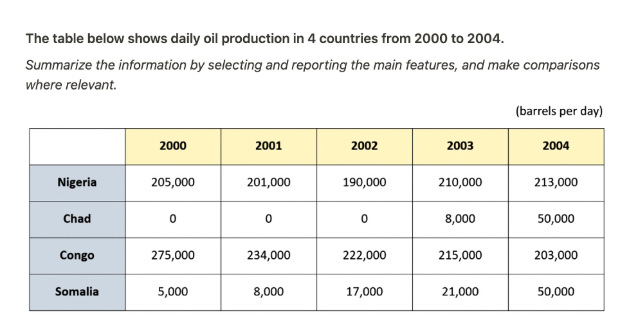
The table illustrates how many oil barrels were produced per day in four countries every year from 2000 to 2004. Overall, while Congo’s oil barrels output witnessed a significant decrease, that of the rest increased to varying degrees. It is also noteworthy that Nigeria’s production rate saw the least change, and it ended up with the highest figure. Looking first at the countries that experienced increases, in 2003, Chad yielded 8000 barrels. This figure then surged to 50000 a year later, a more than sixfold increase after a short period of time. This massive boost in productivity was substantially more significant than the modest gains recorded in Nigeria after four years. This nation saw the number of oil barrels generated per day edging up from 205000 in 2000 to 213000 in 2004. In addition, initially, Somalia made 5000 daily barrels, and this figure had risen to 50000 by 2004. In stark contrast, Congo suffered a consistent decline in its oil production rate. It made 18000 barrels fewer every year on average from 275000 to 203000 between 2000 and 2004. Despite this decline, Congo managed to hold its place as the second highest nation in terms of oil barrels output per day.
Sample Detail
The table below shows daily production in 4 countries from 2000 to 2004
18/07/2026 15:27 8.0 points
Topic
The table below shows daily production in 4 countries from 2000 to 2004
Word count: 201
Chart/Graph
Essay
Overall Scores
8.0±0.5
Excellent
Writing Criteria Scores
TA8.0
CC8.0
LR8.0
GRA8.0
Task Achievement8.0
Target: 7.0
Errors:0
Coherence & Cohesion8.0
Target: 7.0
Errors:1
Lexical Resource8.0
Target: 7.0
Errors:4
Grammar & Accuracy8.0
Target: 7.0
Errors:0
Click on any highlighted text in the essay to view detailed suggestions for improvement.
Deep Analysis
Task 1 - Academic Writing
4 tools available
Sample Essay - IELTS Writing Task 1
No sample essay
Click the button below to analyze and generate a high-quality sample essay for Task 1.