
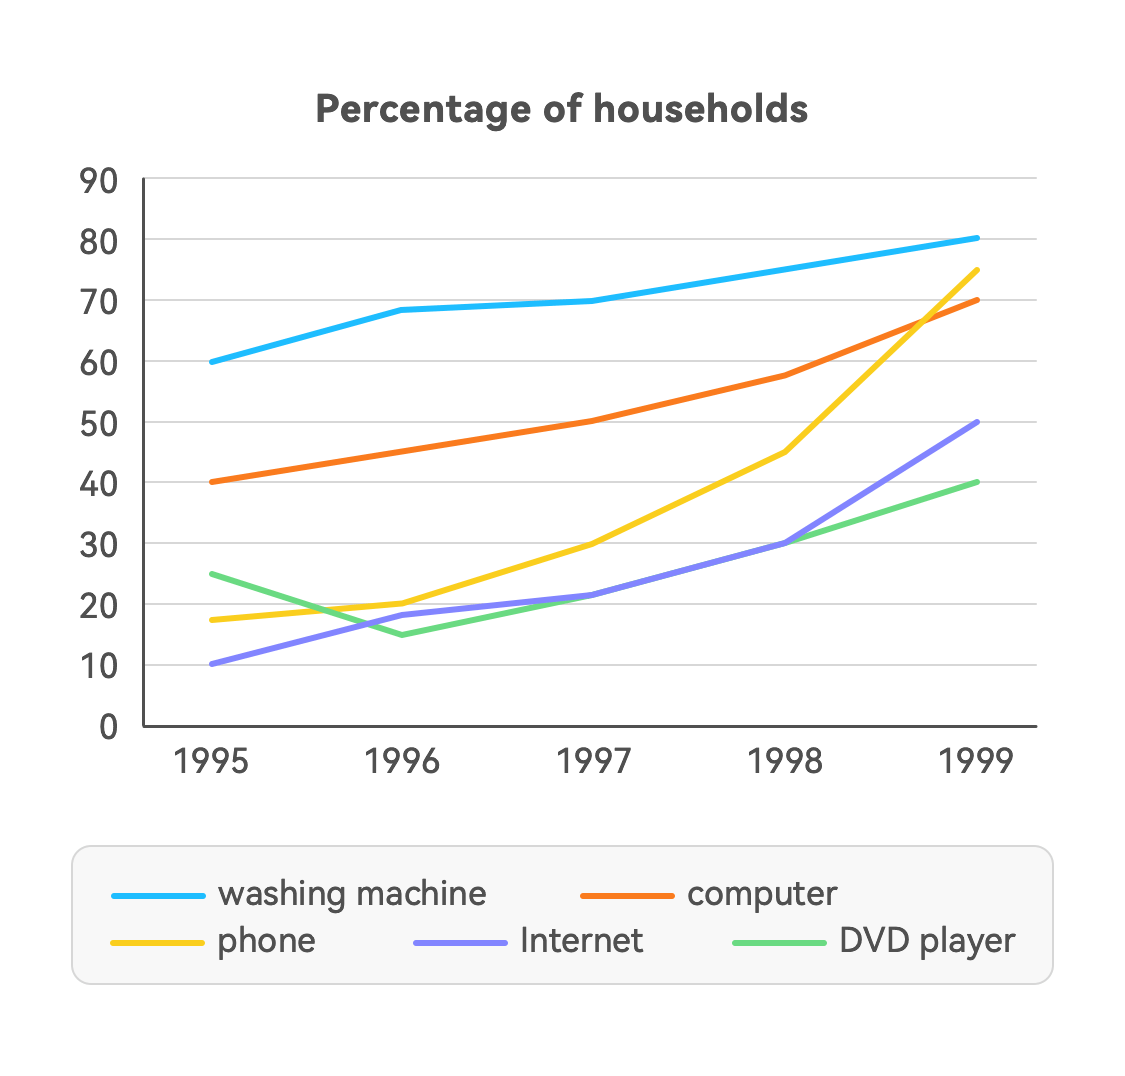
The line chart illustrates the proportion of families associated with various technological devices in America over the 4-year period, commencing in 1995. Overall, all equipment usage increased notably but to different extent, with the figure for washing machine remained the highest. In 1995, washing machine was the most popular device with exactly 60% of households possessed, followed by that of computer, at 40%. Then, both categories witnessed steady rise throughout the period, with the figures of 80% and 70% respectively. Regarding the remaining equipment, in 1995, both phone and Internet utilizations bottomed, after which they increased significantly to around 45% and 30% respectively. From this point, it rocked to 75% and 50%, and computer especially surpassed phone to become the second most common technological device. DVD player, in stark contrast, dropped dramatically from 25% to 15% in 1996, followed by the significant recovery and peaked t 40% by the end of the period.
Sample Detail
The graph below shows the percentage of households with different kinds of technology in the U.S. from 1995 to 1999. Summarize the information by selecting and reporting the main features, and make comparisons where relevant. Write at least 150 words.
18/07/2026 15:29 6.0 points
Topic
The graph below shows the percentage of households with different kinds of technology in the U.S. from 1995 to 1999. Summarize the information by selecting and reporting the main features, and make comparisons where relevant. Write at least 150 words.
Word count: 153
Chart/Graph
Essay
Overall Scores
6.0±0.5
Fair
Writing Criteria Scores
TA6.0
CC6.0
LR6.0
GRA6.0
Task Achievement6.0
Target: 7.0
Errors:0
Coherence & Cohesion6.0
Target: 7.0
Errors:1
Lexical Resource6.0
Target: 7.0
Errors:1
Grammar & Accuracy6.0
Target: 7.0
Errors:0
Click on any highlighted text in the essay to view detailed suggestions for improvement.
Deep Analysis
Task 1 - Academic Writing
4 tools available
Sample Essay - IELTS Writing Task 1
No sample essay
Click the button below to analyze and generate a high-quality sample essay for Task 1.