
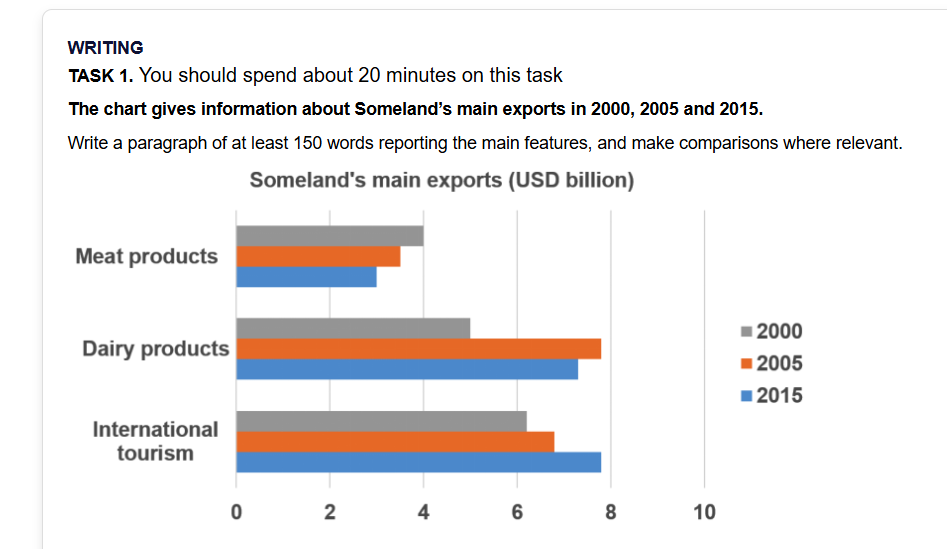
The bar chart compares how many Someland's productions and services were exported in 2000,2005 and 2015 Overall, in 2005, while the figure of dairy products remained the leading sales, the international tourism maintained the dominant position in 2015, whereas the meat products attracted the smallest proportion of exportation, comparing to these two categories In 2005, the sales figures of dairy products topped the chart, accounting for approximately 7,9 billion dollars, followed closely by the international tourism services with the figure reaching 7 billion dollars, whereas, the exportations of meat products lagged far behind, recording only around 3,7 billion dollars. In contrast, in 2015, the services of international tourism ranked first instead of dairy products in comparison with the year 2005 throughout the period, recording around 7,9 billion dollars. The sales of dairy products was less attractive than in 2005, ranked second with a figure of roughly 7,5 billion dollars, whereas, meat products's sales still accounted for the smallest proportion of exportations, just only about 3 billion dollars. In 2000, all the recording of sales in three categories recorded the lowest figure. The international tourism services dominated the chart, accounting for approximately 6 billion dollars and followed closely by the sales of dairy products with a figure of 5 billon dollars, whereas, meat products's exportations was the lowest figure throughout the period. This trend was similar to the top-ranked products in 2015.
Sample Detail
The chart gives information about Someland’s main exports in 2000, 2005 and 2015. Write a paragraph of at least 150 words reporting the main features, and make comparisons where relevant.
18/07/2026 15:37 6.0 points
Topic
The chart gives information about Someland’s main exports in 2000, 2005 and 2015. Write a paragraph of at least 150 words reporting the main features, and make comparisons where relevant.
Word count: 231
Chart/Graph
Essay
Overall Scores
6.0±0.5
Fair
Writing Criteria Scores
TA6.0
CC6.0
LR6.0
GRA6.0
Task Achievement6.0
Target: 7.0
Errors:0
Coherence & Cohesion6.0
Target: 7.0
Errors:4
Lexical Resource6.0
Target: 7.0
Errors:4
Grammar & Accuracy6.0
Target: 7.0
Errors:0
Click on any highlighted text in the essay to view detailed suggestions for improvement.
Deep Analysis
Task 1 - Academic Writing
4 tools available
Sample Essay - IELTS Writing Task 1
No sample essay
Click the button below to analyze and generate a high-quality sample essay for Task 1.