
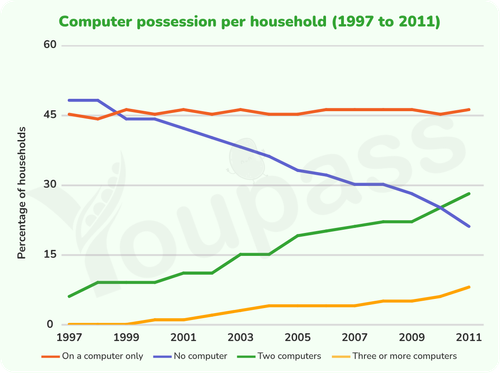
The chart provided illustrates computer possession by household (measured in percentages) in one European country from 1997 to 2011. Overall, the number of households having two and three or more computers saw the most noticeable upward trend while the figure of no computer followed opposite trend. It is also noteworthy that households with three or more computers were virtually non-existent at the beginning of the period. Regarding the number of two and three or more computers, their figures were initially the lowest, but then witnessed a dramatic increase. In 1997, there was no household having three or more computers when the number of two computers was about 7%. Between 1997 and 2005, there was an steady growth in proportion of three or more computers and two computers, which were 4% and 20% respectively. From 2005 onward, three or more computers rose slightly, ending with 7.5% while two computers began to grow significantly, reaching 30% in 2011. Moving to the remaining figures, the number of households possessing one computer saw a moderate fluctuation and the proportion of households without a computer plummeted considerably. In the beginning, no computer and one computer had largest figures, which were about 48% and 45% respectively. Throughout the period, the figure for households with one computer remained mostly unchanged and hovered around 45%. Whilst no computer gradually decreased in 1999 and then saw a substantial decline, intersecting with the figure for two computers owning households in 2010 (24%) before reaching 22%.
Detail Sampel
The graph below gives information about computer possession by household in one European country between 1997 and 2011. Summarise the information by selecting and reporting the main features, and make comparisons where relevant.
18/07/2026 15:48 7.0 skor
Topik
The graph below gives information about computer possession by household in one European country between 1997 and 2011. Summarise the information by selecting and reporting the main features, and make comparisons where relevant.
Jumlah kata: 245
Grafik/Diagram
Essay
Skor Keseluruhan
7.0±0.5
Baik
Skor Kriteria Writing
TA7.0
CC7.0
LR7.0
GRA7.0
Task Achievement7.0
Target: 7.0
Kesalahan:0
Coherence & Cohesion7.0
Target: 7.0
Kesalahan:4
Lexical Resource7.0
Target: 7.0
Kesalahan:3
Grammar & Accuracy7.0
Target: 7.0
Kesalahan:0
Klik teks yang ditandai di esai untuk melihat saran detail untuk peningkatan.
Analisis mendalam
Task 1 - Academic Writing
4 tools available
Esai contoh - IELTS Writing Task 1
Belum ada esai contoh
Silakan klik tombol di bawah untuk menganalisis dan membuat esai contoh berkualitas tinggi untuk Task 1.