
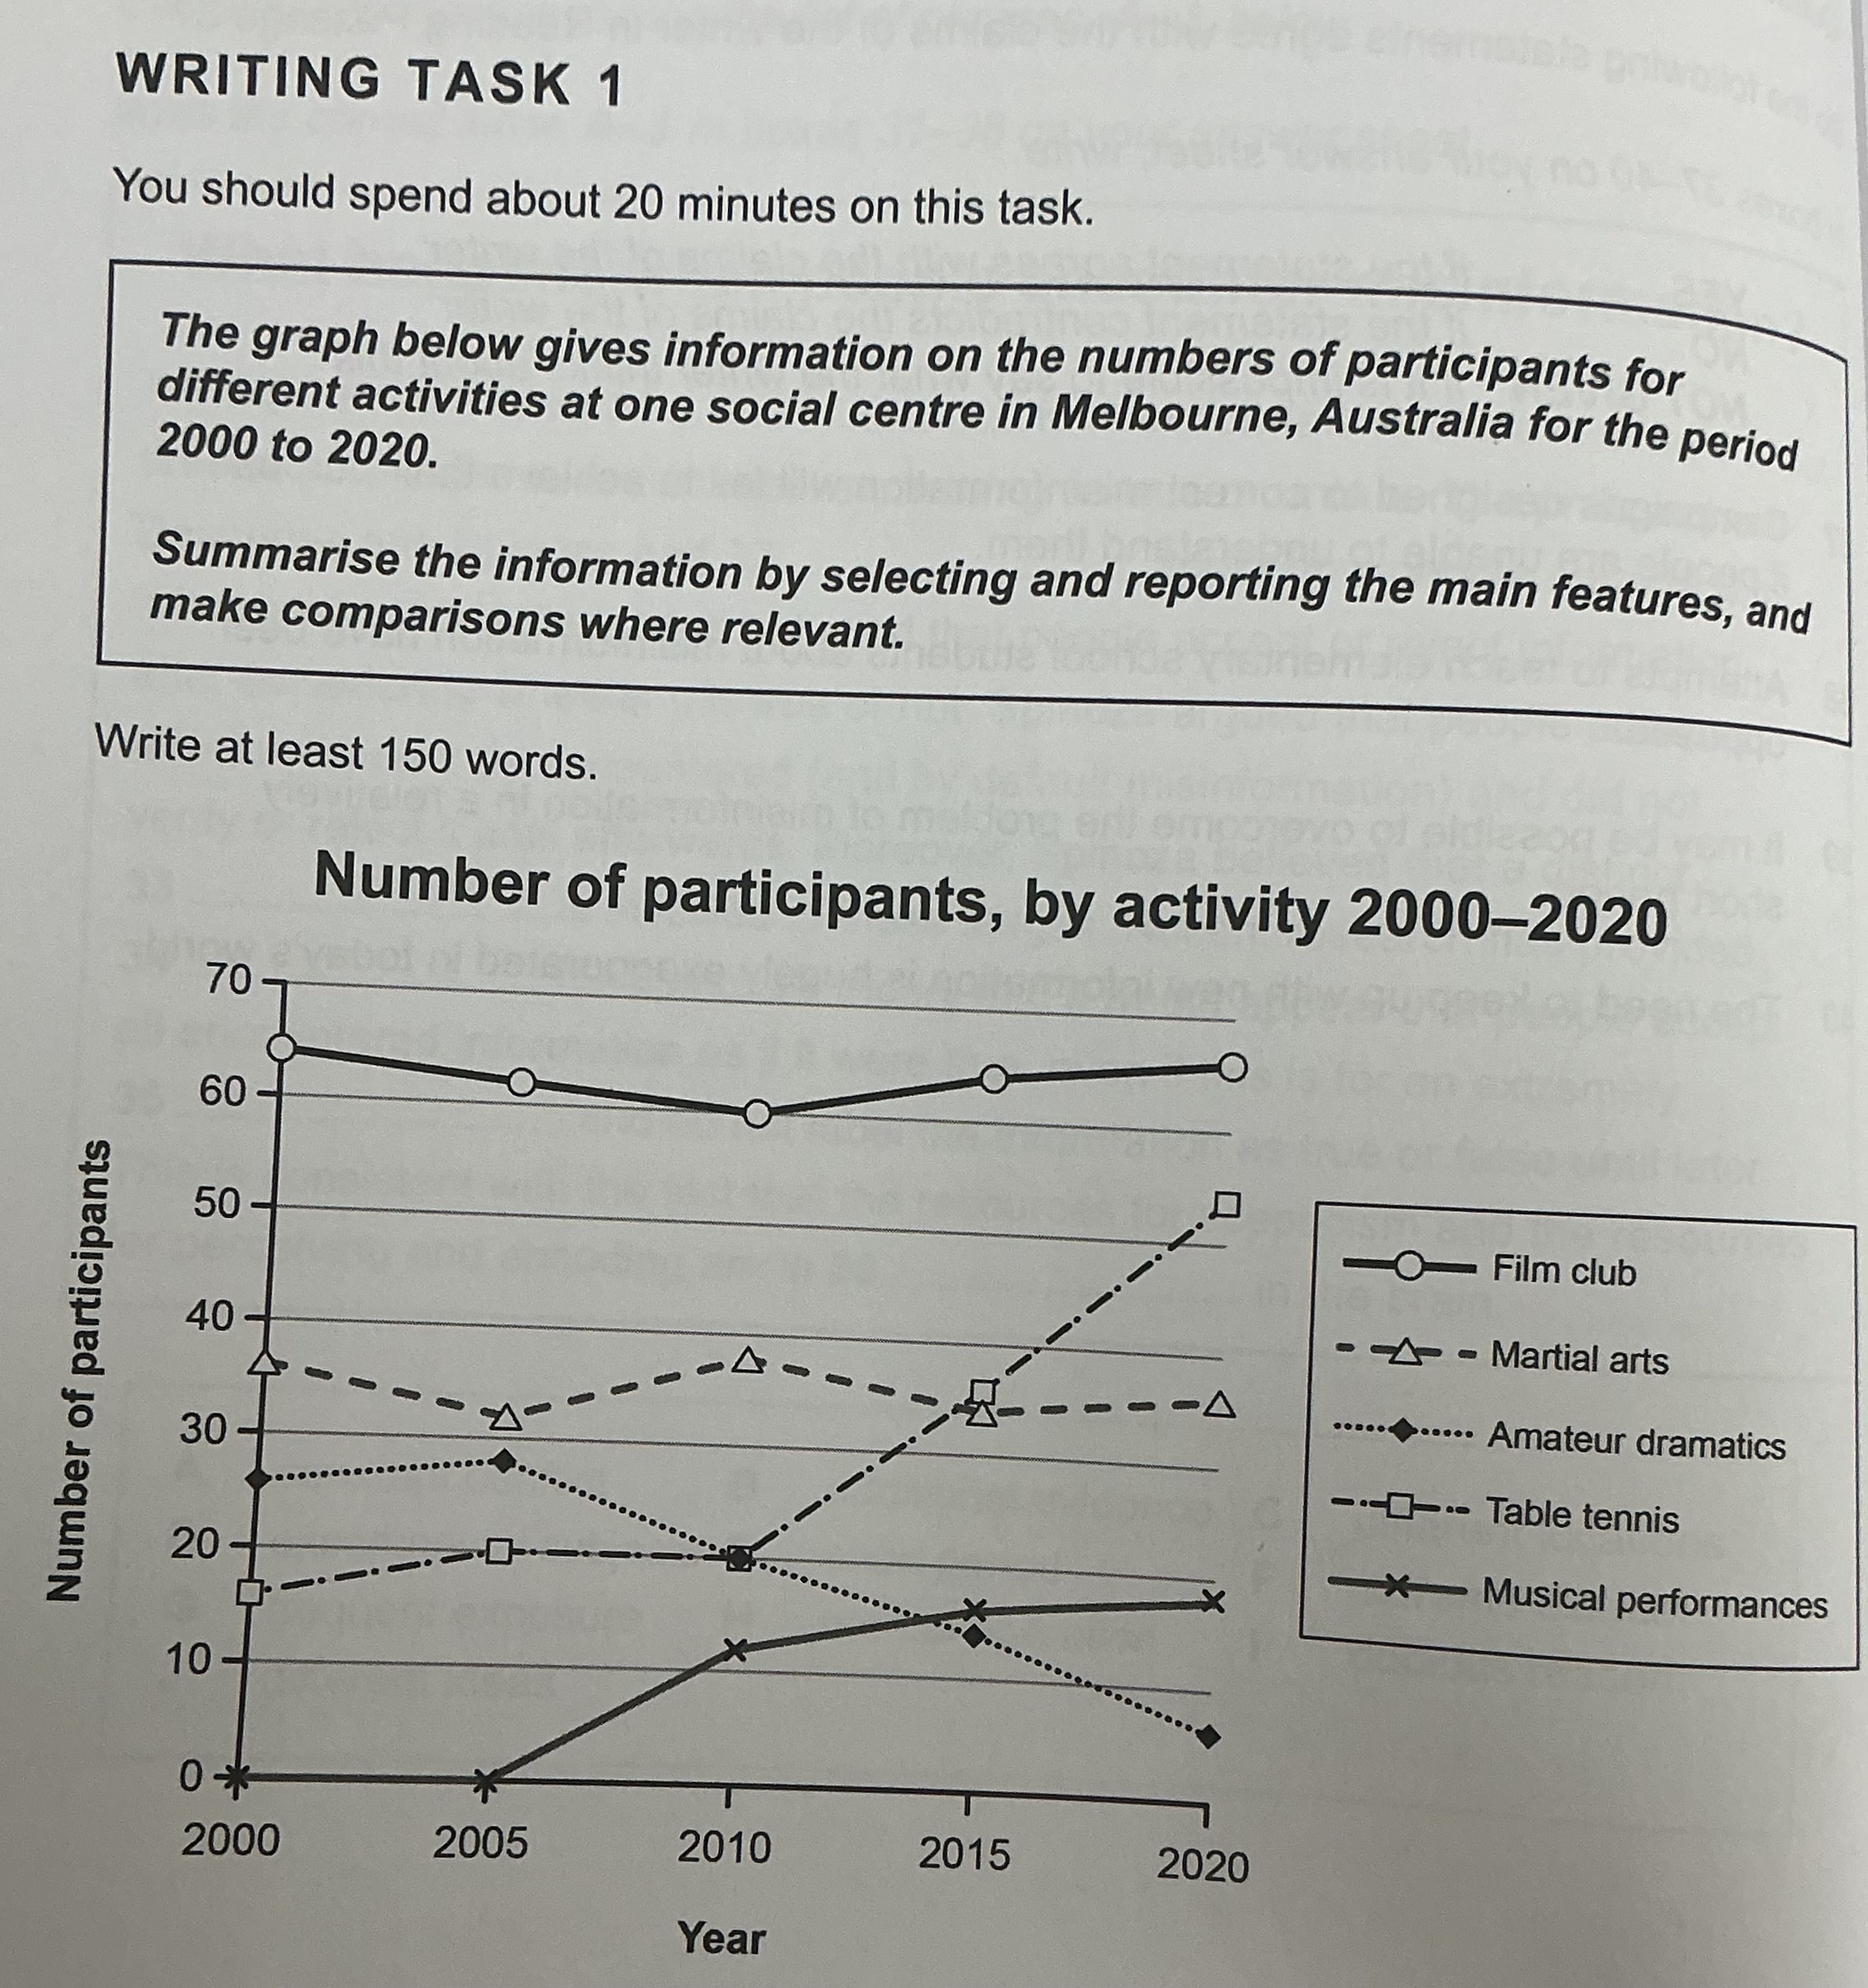
The line graph illustrates the number of participants for different activities. The coverage of the statistics is at one social centre in Melbourne, Australia. The line graph had recorded the changing circumstances of partaking different clubs from 2000 to 2020. Overall, the film club had accounted for the highest proportion over time. The table tennis surged its popularity from 2010, whereas musical performance ascended in 2005. The amateur dramatics had plummeted from 2005 to 2010. The martial art remained stabled over the period. To compare table tennis, musical performance and amateur dramatics clubs, which its participants have widely fluctuated over the years, there are two crossing years, around 2010 and 2015. From 2000 to 2005, the amateur dramatics has the largest group of participants among the three activities, while table tennis was 10 less than it. As musical performance rose its popularity from 2005 to 2010, the circumstances had changed. The lines of amateur dramatics and table tennis overlapped in 2010. Soon, the participant number of table tennis had skyrocketed from 2010 to 2020, remaining the second large activity. Stumbling from 2010 to 2020, amateur dramatics was overtaken by the musical performance club in 2015, maintaining the least participants in 2020. The film club and martial art club remained almost unchanged to their participant number over 20 years. The participant number of film club has dominated the activities, fluctuating between 60 to 70 people and slightly decreased in 2010. Martial art club maintained its participant number between 30 to 40, remaining the second large proportion from 2000 to 2015. However, it place was taken by the surging trend of table tennis, becoming the third large in 2020.
নমুনা বিস্তারিত
The graph below gives information on the numbers of participants for different activities at one social centre in Melbourne, Australia for the period 2000 to 2020. Summarise the information by selecting and reporting the main features, and make comparisons where relevant.
18/07/2026 16:01 6.5 স্কোর
টপিক বা বিষয়
The graph below gives information on the numbers of participants for different activities at one social centre in Melbourne, Australia for the period 2000 to 2020. Summarise the information by selecting and reporting the main features, and make comparisons where relevant.
শব্দ সংখ্যা: 277
চার্ট/গ্রাফ
Essay
সামগ্রিক স্কোর
6.5±0.5
মোটামুটি
রাইটিং মানদণ্ড স্কোর
TA7.0
CC7.0
LR6.0
GRA7.0
Task Achievement7.0
লক্ষ্যমাত্রা: 7.0
ভুল:0
Coherence & Cohesion7.0
লক্ষ্যমাত্রা: 7.0
ভুল:3
Lexical Resource6.0
লক্ষ্যমাত্রা: 7.0
ভুল:6
Grammar & Accuracy7.0
লক্ষ্যমাত্রা: 7.0
ভুল:0
উন্নতির জন্য বিস্তারিত পরামর্শ দেখতে প্রবন্ধের হাইলাইট করা যেকোনো লেখায় ক্লিক করুন।
গভীর বিশ্লেষণ
Task 1 - Academic Writing
4 tools available
নমুনা রচনা - IELTS Writing Task 1
কোনো নমুনা রচনা নেই
টাস্ক ১-এর জন্য উচ্চমানের নমুনা রচনা বিশ্লেষণ এবং তৈরি করতে নিচের বাটনে ক্লিক করুন।