
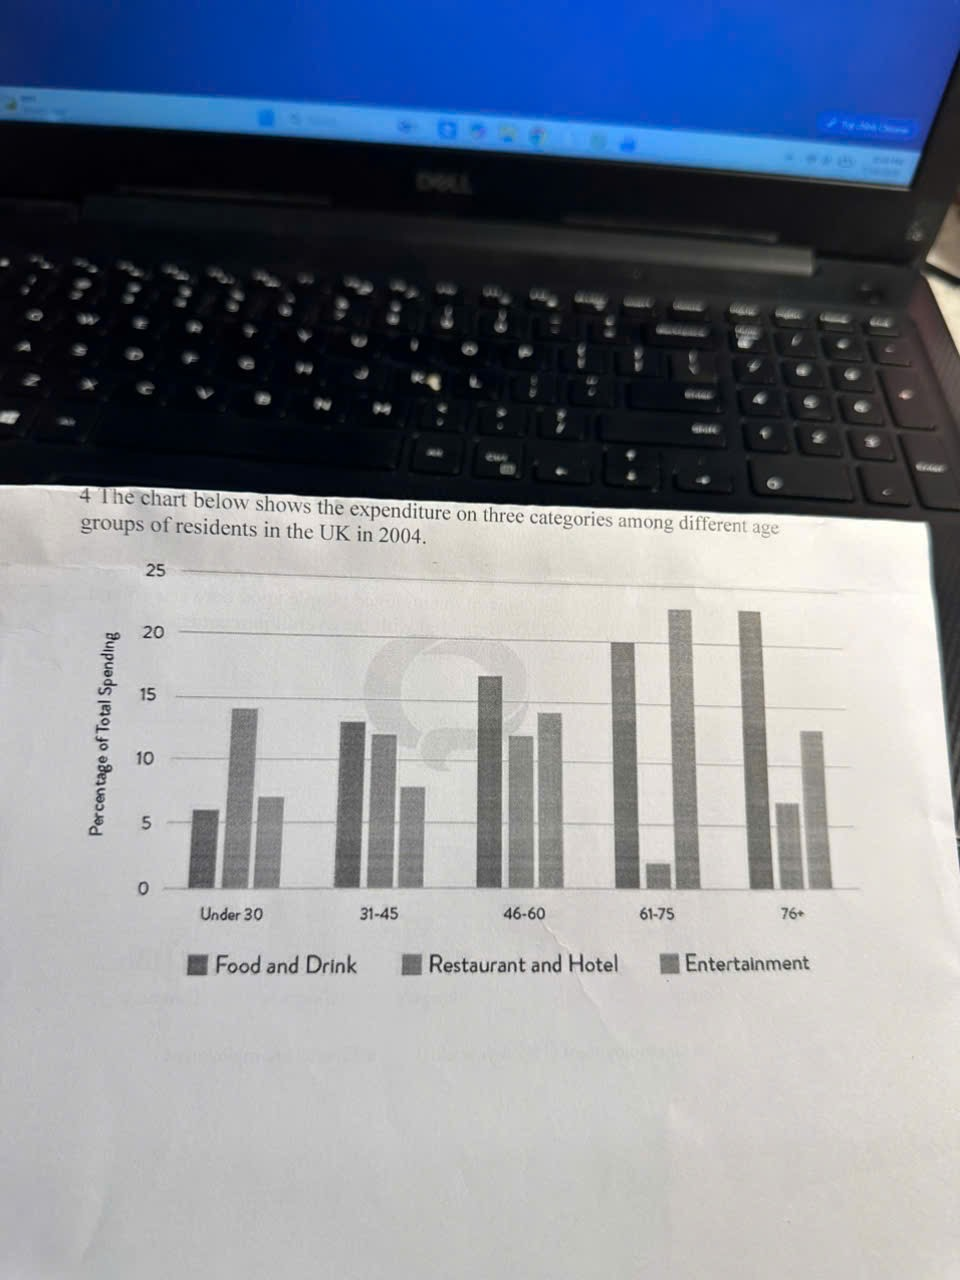
The bar chart gives information about the proportion of spending on food and drink, restaurant and hotel, entertainment in the Uk in 2004. Overall, it is clear that spending on food and drink increased over the period, while expenditure on restaurants and hotels decreased. In addition, the percentage spent on entertainment fluctuated. Looking first at food and drink, the figure increased. People under 30 spent only around 6% then rose to approximately 13% among people aged 31-45 and 17% for 46-60 group. The percentage of people age 61-75 and 76+ spent on food and drink were 20% and 22%, respectively. Expenditure on restaurants and hotels declined over the period. It was highest among people under 30, at about 14%, before decreasing to around 12% for both the 31–45 and 46–60 groups. Spending dropped sharply to only about 2% among people aged 61–75, before recovering slightly to around 7% in the oldest group. The proportion of people spending on entertainment fluctuated over the period. With only 8% for people under 30 and 8% for people aged 31-45. Then fluctuated between 12% and 12.5%, peaked at 22% for 61-75 aged group.
รายละเอียดตัวอย่าง
the chart below shows the expenditure on three categories among different aga groups of residents in the Uk in 2004
18/07/2026 16:06 5.5 คะแนน
หัวข้อ
the chart below shows the expenditure on three categories among different aga groups of residents in the Uk in 2004
จำนวนคำ: 189
แผนภูมิ/กราฟ
Essay
คะแนนรวม
5.5±0.5
พื้นฐาน
คะแนนเกณฑ์การเขียน
TA5.0
CC6.0
LR6.0
GRA6.0
Task Achievement5.0
เป้าหมาย: 7.0
ข้อผิดพลาด:1
Coherence & Cohesion6.0
เป้าหมาย: 7.0
ข้อผิดพลาด:3
Lexical Resource6.0
เป้าหมาย: 7.0
ข้อผิดพลาด:2
Grammar & Accuracy6.0
เป้าหมาย: 7.0
ข้อผิดพลาด:0
คลิกข้อความที่ไฮไลต์ในเรียงความเพื่อดูคำแนะนำรายละเอียดเพื่อพัฒนา
การวิเคราะห์เชิงลึก
Task 1 - Academic Writing
4 tools available
บทความตัวอย่าง - IELTS Writing Task 1
ยังไม่มีบทความตัวอย่าง
กดปุ่มด้านล่างเพื่อวิเคราะห์และสร้างบทความตัวอย่างคุณภาพสูงสำหรับ Task 1