
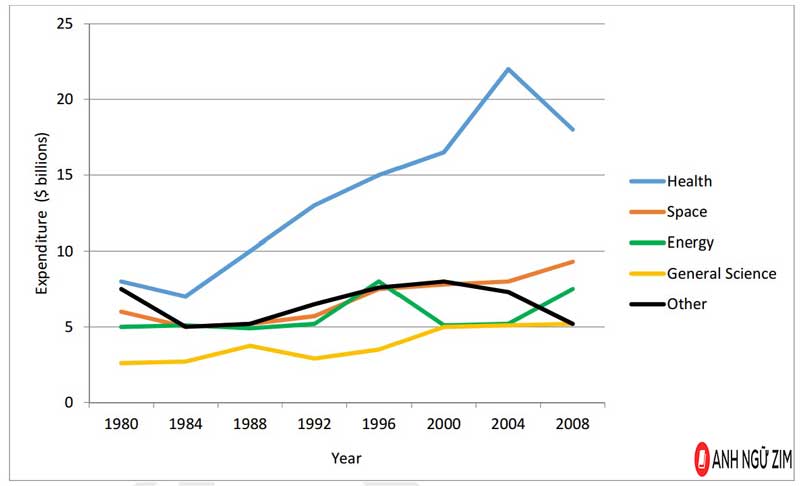
The line graph compares how much money was spent on different fields of research by the U.S. government from 1980 to 2008. Overall, expenditure on almost all sectors exhibited an increase, with the health group by far dominating over time. The converse trend was recorded in spending on other purposes. Looking firstly at the amount of money invested in health and the other group, during the first 4 years, both categories shared a similar tendency, with a decrease to roughly 7 billion dollars and 5 billion dollars, correspondingly. In the 16 years following, spending on health and the other group witnessed the same trend again with a rise in both groups; however, health dramatically surged to more than 16 billion dollars, taking the lead with the largest amount of expenditure. From between 2000 to the final year, these two fields finally experienced a converse trend. Specifically, while health continued to climb to approximately 22 billion dollars, reaching its peak in the middle of 2004, money spent on other purposes declined to a mere 5 billion dollars, marking the same amount of money as general science. In the remaining patterns, energy decreased together to 5 billion dollars, converging each other in 1984 and went through fluctuations until 1992. In contrast, the U.S. government spent a little more money on general science, followed by a stable status in 1992. Notably, from 1992 to 2000, a rise was recorded in space and general science, while energy reached its peak and then rapidly went down to 5 billion dollars, being the field with the same amount of money spent on as general science. In the final period, general science still remained unchanged, while the other 2 groups increased, especially energy, climbing by roughly 2 billion dollars, overtaking the expenditure spent for other purposes as well as general science.
নমুনা বিস্তারিত
The graph below gives information about U.S. government spending on research between 1980 and 2008.
18/07/2026 16:06 7.0 স্কোর
টপিক বা বিষয়
The graph below gives information about U.S. government spending on research between 1980 and 2008.
শব্দ সংখ্যা: 304
চার্ট/গ্রাফ
Essay
সামগ্রিক স্কোর
7.0±0.5
ভালো
রাইটিং মানদণ্ড স্কোর
TA7.0
CC7.0
LR7.0
GRA7.0
Task Achievement7.0
লক্ষ্যমাত্রা: 7.0
ভুল:0
Coherence & Cohesion7.0
লক্ষ্যমাত্রা: 7.0
ভুল:3
Lexical Resource7.0
লক্ষ্যমাত্রা: 7.0
ভুল:4
Grammar & Accuracy7.0
লক্ষ্যমাত্রা: 7.0
ভুল:0
উন্নতির জন্য বিস্তারিত পরামর্শ দেখতে প্রবন্ধের হাইলাইট করা যেকোনো লেখায় ক্লিক করুন।
গভীর বিশ্লেষণ
Task 1 - Academic Writing
4 tools available
নমুনা রচনা - IELTS Writing Task 1
কোনো নমুনা রচনা নেই
টাস্ক ১-এর জন্য উচ্চমানের নমুনা রচনা বিশ্লেষণ এবং তৈরি করতে নিচের বাটনে ক্লিক করুন।