
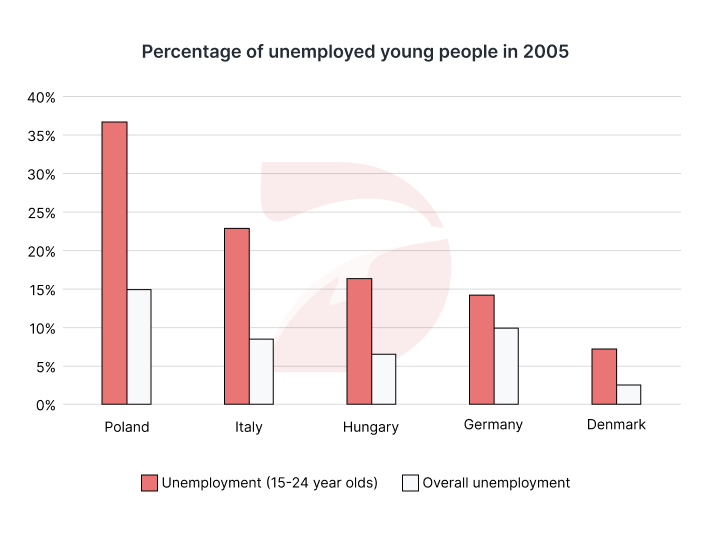
The bar chart illustrates the proportion of joblessness people in the 15-24 age bracket and 24 in five different countries in Europe in 2005, compared with the total rates of unemployment in those countries Overall, five countries all witnessed the higher rate in people in aged 15 to 24 who were unemployed. In particularly, it was in Poland that the proportion of joblessness in 15-24-year-old individuals was the greatest, either the total rate of that, while the figures for Denmark was the lowest. Looking first at three first highest countries, Poland started at the highest point of the survey at over 35% and the overall percentage was also the peak among 5 countries at exact 15%. The following was Italy which had the percentage of 15 to 24-year-olds without jobs equal 2 out three of the former, while the general of that rates were even lower just equal a half of those in Poland. This figures of overall joblessness in Italy were also recorded at a similar level in Hungary at around 8%, but others proportion was significant lower at over 15% Turning to the others countries, the downward trend in unemployed rates of people in aged 15-24 through each countries still remained stable that the figures of those in Germany were 3% lower than the former, however, the overall unemployment saw a reverse trend to nearly 10%. Finally, the lowest point of joblessness in people aged from 15 to 24 was recorded in Denmark at 7%, and a half of that was in the overall rates
รายละเอียดตัวอย่าง
The chart below shows the percentage of unemployed people aged between 15 and 24 in five European countries in 2005, compared with the overall percentage of unemployment in those countries. Summarise the information by selecting and reporting the main features, and make comparisons where relevant.
18/07/2026 16:15 5.0 คะแนน
หัวข้อ
The chart below shows the percentage of unemployed people aged between 15 and 24 in five European countries in 2005, compared with the overall percentage of unemployment in those countries. Summarise the information by selecting and reporting the main features, and make comparisons where relevant.
จำนวนคำ: 257
แผนภูมิ/กราฟ
Essay
คะแนนรวม
5.0±0.5
พื้นฐาน
คะแนนเกณฑ์การเขียน
TA6.0
CC5.0
LR5.0
GRA5.0
Task Achievement6.0
เป้าหมาย: 7.0
ข้อผิดพลาด:1
Coherence & Cohesion5.0
เป้าหมาย: 7.0
ข้อผิดพลาด:10
Lexical Resource5.0
เป้าหมาย: 7.0
ข้อผิดพลาด:10
Grammar & Accuracy5.0
เป้าหมาย: 7.0
ข้อผิดพลาด:0
คลิกข้อความที่ไฮไลต์ในเรียงความเพื่อดูคำแนะนำรายละเอียดเพื่อพัฒนา
การวิเคราะห์เชิงลึก
Task 1 - Academic Writing
4 tools available
บทความตัวอย่าง - IELTS Writing Task 1
ยังไม่มีบทความตัวอย่าง
กดปุ่มด้านล่างเพื่อวิเคราะห์และสร้างบทความตัวอย่างคุณภาพสูงสำหรับ Task 1