
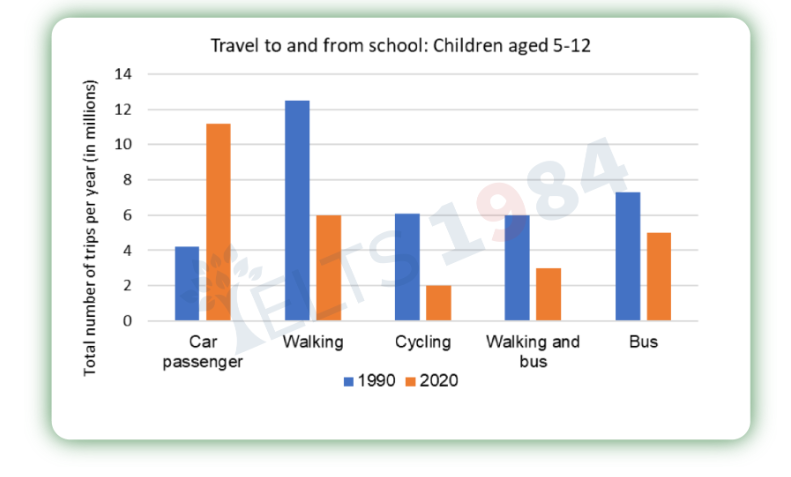
The bar chart illustrates the number of trips to schools made by five different modes of transportation by children aged 5-12 in a particular country in 1990 and 2020. Overall, there was a shift from active means of transport towards more passive ones, with the the most common choice in 1990 is walking, whereas car became more preferred in 30 years later. Looking first at the former year, the number of trips to schools by walking made up the dominance with over 12 million, significantly exceeding that of bus with around 7,3 million. Following these figures, cycling and the combination of walking and bus shared the identical number with 6 million each. Car was the least common choice among school children, recording approximately 4,1 million trips. In contrast, in 2020, children’s preference has changed considerably when car was the most prevalent vehicle to commute with about 11,3 million, nearly doubling that of walking and bus with 6 million and 5 million respectively. Finally, trips by walking and bus accounted for a modest number with roughly 3 million compared to the lowest figure (2 million) recorded in cycling.
Sample Detail
The chart below shows the number of trips made by children in one country in 1990 and 2020 to travel; to and from school using different modes of transport. Summarise the information by selecting and reporting the main features, and make comparisons where relevant.
18/07/2026 16:17 6.5 points
Topic
The chart below shows the number of trips made by children in one country in 1990 and 2020 to travel; to and from school using different modes of transport. Summarise the information by selecting and reporting the main features, and make comparisons where relevant.
Word count: 187
Chart/Graph
Essay
Overall Scores
6.5±0.5
Fair
Writing Criteria Scores
TA7.0
CC7.0
LR6.0
GRA6.0
Task Achievement7.0
Target: 7.0
Errors:1
Coherence & Cohesion7.0
Target: 7.0
Errors:3
Lexical Resource6.0
Target: 7.0
Errors:3
Grammar & Accuracy6.0
Target: 7.0
Errors:0
Click on any highlighted text in the essay to view detailed suggestions for improvement.
Deep Analysis
Task 1 - Academic Writing
4 tools available
Sample Essay - IELTS Writing Task 1
No sample essay
Click the button below to analyze and generate a high-quality sample essay for Task 1.