
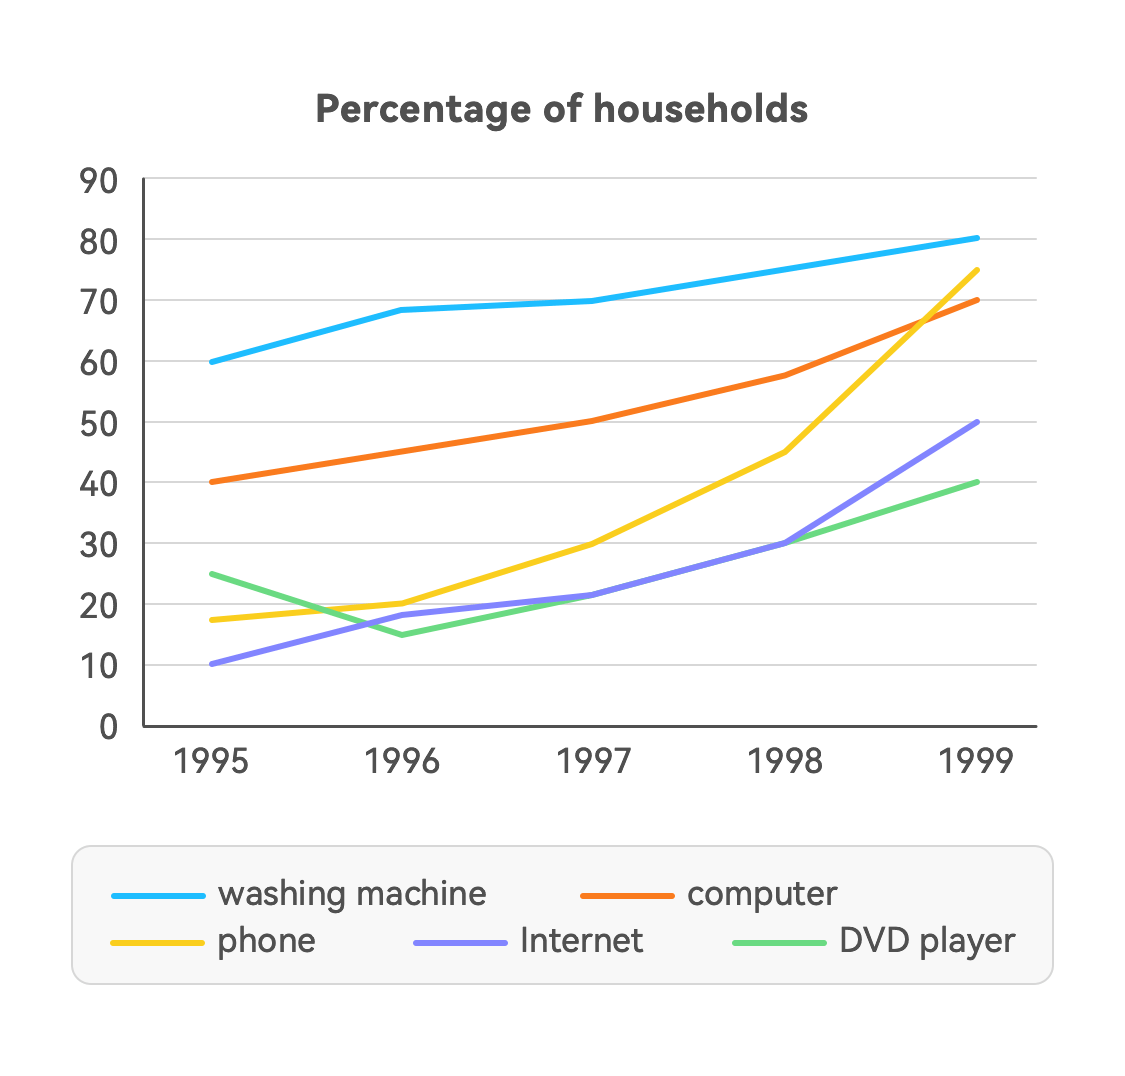
The given charts illustrate the percentage of households with different kinds of technology in the U.S between 1995 and 1999. In general, the figures for computers and phones saw a rise, while those of the others witnessed a rise over the period shown. Additionally, it is obvious that the figure for the washing machine was the highest, whereas the figure for the DVD player was the lowest over the given time. As can be seen in the charts, in 1995, the figure for the washing machine was the highest with 60%, followed by the computer and the DVD player with 40% and 25% respectively. 2 years later, the washing machine's figure increased to 70%. The figure for the computer experienced a similar trend, which rose from 40 to 50%. Moreover, the DVD player's figure went down from 25% to 15% in the same period. From 1995 to 1997, the figures for the internet and the phone increased to 22% and 30%. It is also noticed that from 1997 to 1999, the figure for the washing machine grew from 70% to 80%. Meanwhile, the computer's figure took up 50% and went up to 70% during the same period. Furthermore, the figure for the DVD player was at 22% in 1997 and reached to 40% in the same period. Additionally, the phone's figure took up 30% and increased to 75% from 1997 to 1999. Finally, the figure for the internet was at 22% in 1997 and reached to 50% by the end of the preriod
नमूना विवरण
The graph below shows the percentage of households with different kinds of technology in the U.S. from 1995 to 1999. Summarize the information by selecting and reporting the main features, and make comparisons where relevant. Write at least 150 words.
18/07/2026 16:18 5.5 अंक
विषय
The graph below shows the percentage of households with different kinds of technology in the U.S. from 1995 to 1999. Summarize the information by selecting and reporting the main features, and make comparisons where relevant. Write at least 150 words.
शब्दों की संख्या: 253
चार्ट/ग्राफ
Essay
समग्र स्कोर
5.5±0.5
बुनियादी
राइटिंग मानदंड स्कोर
TA5.0
CC6.0
LR6.0
GRA6.0
Task Achievement5.0
लक्ष्य: 7.0
त्रुटियां:1
Coherence & Cohesion6.0
लक्ष्य: 7.0
त्रुटियां:3
Lexical Resource6.0
लक्ष्य: 7.0
त्रुटियां:3
Grammar & Accuracy6.0
लक्ष्य: 7.0
त्रुटियां:0
सुधार के विस्तृत सुझाव देखने के लिए लेख में किसी भी हाइलाइट किए गए टेक्स्ट पर क्लिक करें।
गहन विश्लेषण
Task 1 - Academic Writing
4 उपकरण उपलब्ध
नमूना लेख - IELTS Writing Task 1
कोई नमूना लेख नहीं
Task 1 के लिए उच्च-गुणवत्ता वाला नमूना लेख विश्लेषण और बनाने के लिए नीचे दिए गए बटन पर क्लिक करें।