
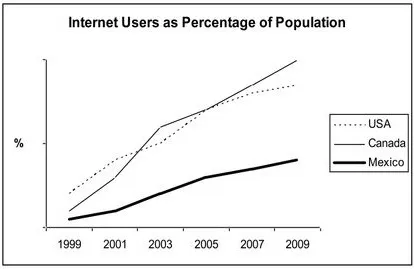
The line graph illustrate/ depicts changes in the proportion of people using the Internet in the USA, Canada, and Mexico over the decade from 1999 to 2009. Overall, it is evident that the percentage of Internet users in all three nations experienced a consistent upward trend throughout the decade. While the USA and Canada maintained significantly higher rates of Internet access compared to Mexico, it is notable that the positions of the two leading countries fluctuated over the period, with Canada ultimately emerging as the leader by 2009. In 1999, the USA had the highest percentage of Internet users, starting at a higher level than Canada. However, the gap between the two nations narrowed rapidly, leading to an intersection in 2002 at approximately 30%. Following this point, Canada briefly took the lead, but the two countries' growth rates fluctuated, resulting in another intersection around 2006 at roughly 60%. From 2006 onwards, Canada exhibited a more steady and sustained upward trajectory, finishing the period as the country with the highest Internet usage rate in 2009, whereas the USA’s growth appeared to stabilize at a slightly lower level. In contrast, Mexico started with a negligible percentage of Internet users in 1999. Although the country experienced a gradual increase throughout the decade, its growth remained the slowest among the three. By the end of the period in 2009, despite the rise, Mexico's Internet penetration rate remained substantially lower than that of its North American neighbors.
Detail Sampel
The graph shows the percentage of Internet users in three countries from 1999 to 2009. Summarize the information by selecting and reporting the main features, and make comparisons where relevant. Write at least 150 words.
18/07/2026 16:22 8.0 skor
Topik
The graph shows the percentage of Internet users in three countries from 1999 to 2009. Summarize the information by selecting and reporting the main features, and make comparisons where relevant. Write at least 150 words.
Jumlah kata: 242
Grafik/Diagram
Essay
Skor Keseluruhan
8.0±0.5
Sangat baik
Skor Kriteria Writing
TA8.0
CC8.0
LR8.0
GRA8.0
Task Achievement8.0
Target: 7.0
Kesalahan:0
Coherence & Cohesion8.0
Target: 7.0
Kesalahan:0
Lexical Resource8.0
Target: 7.0
Kesalahan:2
Grammar & Accuracy8.0
Target: 7.0
Kesalahan:0
Klik teks yang ditandai di esai untuk melihat saran detail untuk peningkatan.
Analisis mendalam
Task 1 - Academic Writing
4 tools available
Esai contoh - IELTS Writing Task 1
Belum ada esai contoh
Silakan klik tombol di bawah untuk menganalisis dan membuat esai contoh berkualitas tinggi untuk Task 1.