
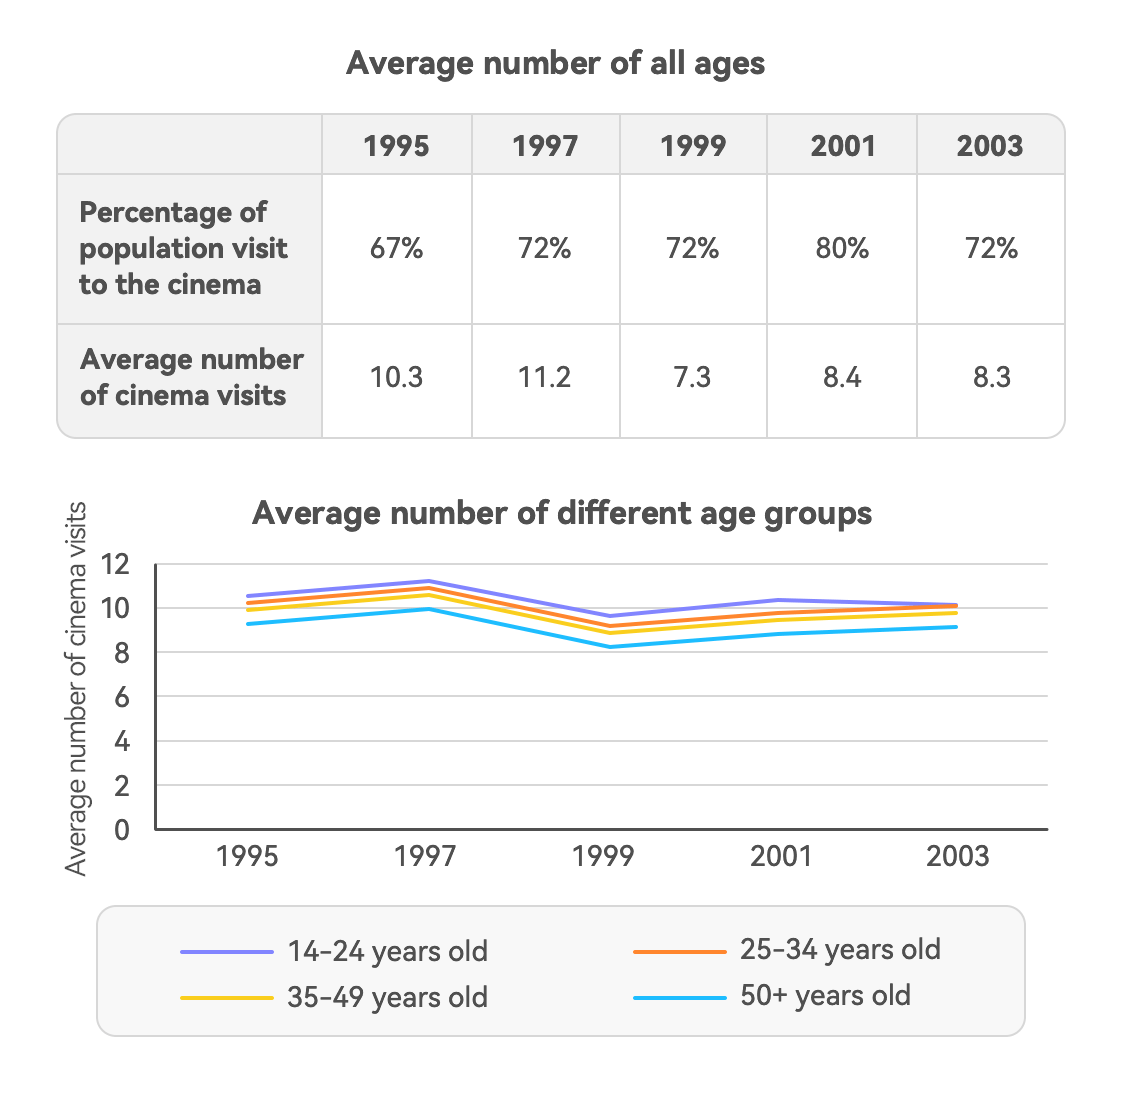
The given table and line graph provide the information about the proportion of people visiting cinema, the average number of cinema visits and the average number of visits made by four age groups from 1995 to 2003. Overall, the percentage of population visit to the cinema generally increased and reached a peak in 2001 before falling in 2003. Meanwhile the number of cinema visits fluctured over the period. In addition, the age group from 14 to 24 years old visiting to cinema was more frequently than the other age groups. According to the table, 67% of population visit to the cinema in 1995. This figure rose considerably to 72% in 1997 and 1999, before peaking at the highest number with 80% in 2001. However, it declined to 72% in the end of this period. Regarding the average number of cinema visits, the figure soared from 10.3% in 1995 to 11.2% in 1997 before witnessing a significant decrease in 1999 with only 7.3%. Although this number surged to 8.4% in 2001, it slightly diminished to 8.3% in 2003. It is clear from the line graph that the young group from 14 to 24 years old alway outperformed all of other age groups over the period, meanwhile the group of more 50 years old remained stable at a smallest number. Markebly, all four age groups followed a similar pattern. Their average number of cinema visits increased remarkably in 1997 but falled strongly in 1999. After 1999, except for the youngest group decreasing from approximately 12 in 2001 to 10 in 2003 , all of the others rose steadly to the end of the period
নমুনা বিস্তারিত
The table and graph below show information about cinema visits in Auckland between 1995 and 2003. Summarize the information by selecting and reporting the main features, and make comparisons where relevant. Write at least 150 words.
18/07/2026 16:21 5.5 স্কোর
টপিক বা বিষয়
The table and graph below show information about cinema visits in Auckland between 1995 and 2003. Summarize the information by selecting and reporting the main features, and make comparisons where relevant. Write at least 150 words.
শব্দ সংখ্যা: 272
চার্ট/গ্রাফ
Essay
সামগ্রিক স্কোর
5.5±0.5
প্রাথমিক
রাইটিং মানদণ্ড স্কোর
TA6.0
CC6.0
LR5.0
GRA6.0
Task Achievement6.0
লক্ষ্যমাত্রা: 7.0
ভুল:3
Coherence & Cohesion6.0
লক্ষ্যমাত্রা: 7.0
ভুল:7
Lexical Resource5.0
লক্ষ্যমাত্রা: 7.0
ভুল:3
Grammar & Accuracy6.0
লক্ষ্যমাত্রা: 7.0
ভুল:0
উন্নতির জন্য বিস্তারিত পরামর্শ দেখতে প্রবন্ধের হাইলাইট করা যেকোনো লেখায় ক্লিক করুন।
গভীর বিশ্লেষণ
Task 1 - Academic Writing
4 tools available
নমুনা রচনা - IELTS Writing Task 1
কোনো নমুনা রচনা নেই
টাস্ক ১-এর জন্য উচ্চমানের নমুনা রচনা বিশ্লেষণ এবং তৈরি করতে নিচের বাটনে ক্লিক করুন।