
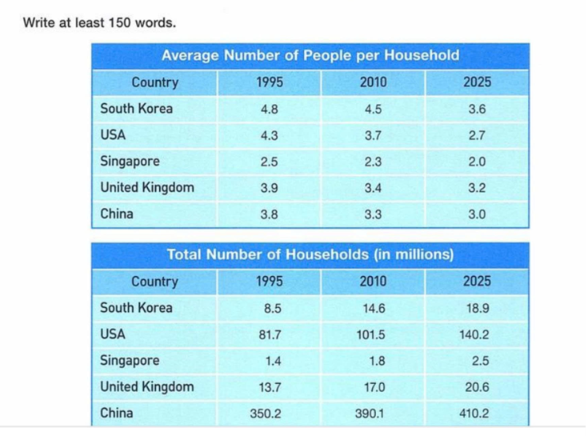
The two provided tables respectively illustrate the average member count in a household and the total number of families from five nations in three main periods: 1995, 2010, and 2025. Overall, the first tables are characterised by a descending trend, especially South Korea’s data, which constantly account for the highest figure. Meanwhile, the remaining table shows a reversal in which the total number of China’s Households is the most striking. In 1995, each South Korean family was estimated to have 4.8 members; this figure decreased slightly by 0.3 in 2010, before being expected to reach 3.6 in 2025. In contrast, the figure of Singapore showed a more insignificant figure, starting with 2.5, which is estimated to be at the bottom of the table (at 2.0). Additionally, 2025 witnessed a similar downward trend in the three remaining categories, namely the USA, the United Kingdom, and China, reaching 2.7, 3.2, and 3.0 in 2025, respectively. China’s household count overshadowed all the remaining figures in the latter table, at 350.2 million in 1995 before being expected to peak at 410.2 million in 2025, which is roughly 164 times higher than that of Singapore (only 2.5 million) at the same time. A similar upward trend can be seen in the USA, where it is predicted to reach 140.2 million households in 2025, with only 81.7 million in 1995. Furthermore, there are 18.9 and 20.6 million families in South Korea and the United Kingdom, respectively, in the last period
Detail Sampel
The first table shows the average number of people living in one household in five countries in the years 1995 and 2010, and predictions for 2025. The second table shows the total number of households, in millions, in the five countries in the same two periods. Summarise the information by selecting and reporting the main features, and make comparisons where relevant.
18/07/2026 16:26 7.5 skor
Topik
The first table shows the average number of people living in one household in five countries in the years 1995 and 2010, and predictions for 2025. The second table shows the total number of households, in millions, in the five countries in the same two periods. Summarise the information by selecting and reporting the main features, and make comparisons where relevant.
Jumlah kata: 244
Grafik/Diagram
Essay
Skor Keseluruhan
7.5±0.5
Baik
Skor Kriteria Writing
TA8.0
CC8.0
LR7.0
GRA7.0
Task Achievement8.0
Target: 7.0
Kesalahan:0
Coherence & Cohesion8.0
Target: 7.0
Kesalahan:1
Lexical Resource7.0
Target: 7.0
Kesalahan:3
Grammar & Accuracy7.0
Target: 7.0
Kesalahan:0
Klik teks yang ditandai di esai untuk melihat saran detail untuk peningkatan.
Analisis mendalam
Task 1 - Academic Writing
4 tools available
Esai contoh - IELTS Writing Task 1
Belum ada esai contoh
Silakan klik tombol di bawah untuk menganalisis dan membuat esai contoh berkualitas tinggi untuk Task 1.