
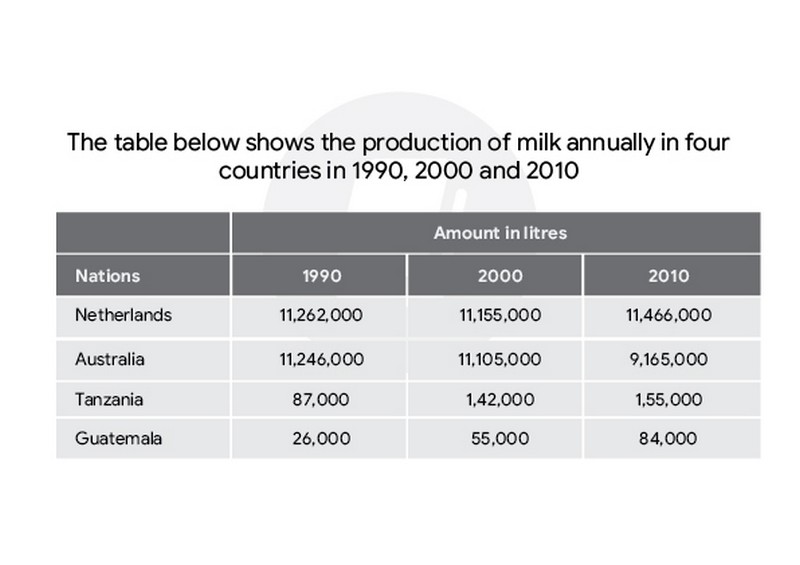
The table compares the annual milk production in four countries in three years, namely 1990, 2000 and 2010, measured in litres. Overall, the annual milk production in the Netherlands, Tanzania and Guatemala followed different upward trends except that of Australia decreased drastically during the period. It is clear that the Netherlands and Australia produced significantly more milk than the other two countries. In the Netherlands, milk production remained relatively stable , fluctuating slightly from exactly 11,262,000 in 1990 to 11,155,000 in 2000, before rising dramatically to 11,466,000 in 2010. Regarding Australia, the milk production experienced substantial decline, falling remarkably by 2,081,000 litres between 1990 and 2010. The figures for both Tanzania and Guatemala increased considerably over the period. There was steady growth in the annual milk production in Tanzania, almost doubling during the period of twenty years. Similarly, the figure for Guatemala also rose progressively from 26,000 in 1990 to 84,000 in 2010, increasing 58,000. In conlusion,Tanzania and Guatemala growing sharply in twenty years.
รายละเอียดตัวอย่าง
The table below shows the production of milk annually in four countries in 1990, 2000 and 2010. Write at least 150 words.
18/07/2026 16:44 7.0 คะแนน
หัวข้อ
The table below shows the production of milk annually in four countries in 1990, 2000 and 2010. Write at least 150 words.
จำนวนคำ: 164
แผนภูมิ/กราฟ
Essay
คะแนนรวม
7.0±0.5
ดีมาก
คะแนนเกณฑ์การเขียน
TA7.0
CC7.0
LR7.0
GRA7.0
Task Achievement7.0
เป้าหมาย: 7.0
ข้อผิดพลาด:0
Coherence & Cohesion7.0
เป้าหมาย: 7.0
ข้อผิดพลาด:2
Lexical Resource7.0
เป้าหมาย: 7.0
ข้อผิดพลาด:1
Grammar & Accuracy7.0
เป้าหมาย: 7.0
ข้อผิดพลาด:0
คลิกข้อความที่ไฮไลต์ในเรียงความเพื่อดูคำแนะนำรายละเอียดเพื่อพัฒนา
การวิเคราะห์เชิงลึก
Task 1 - Academic Writing
4 tools available
บทความตัวอย่าง - IELTS Writing Task 1
ยังไม่มีบทความตัวอย่าง
กดปุ่มด้านล่างเพื่อวิเคราะห์และสร้างบทความตัวอย่างคุณภาพสูงสำหรับ Task 1