
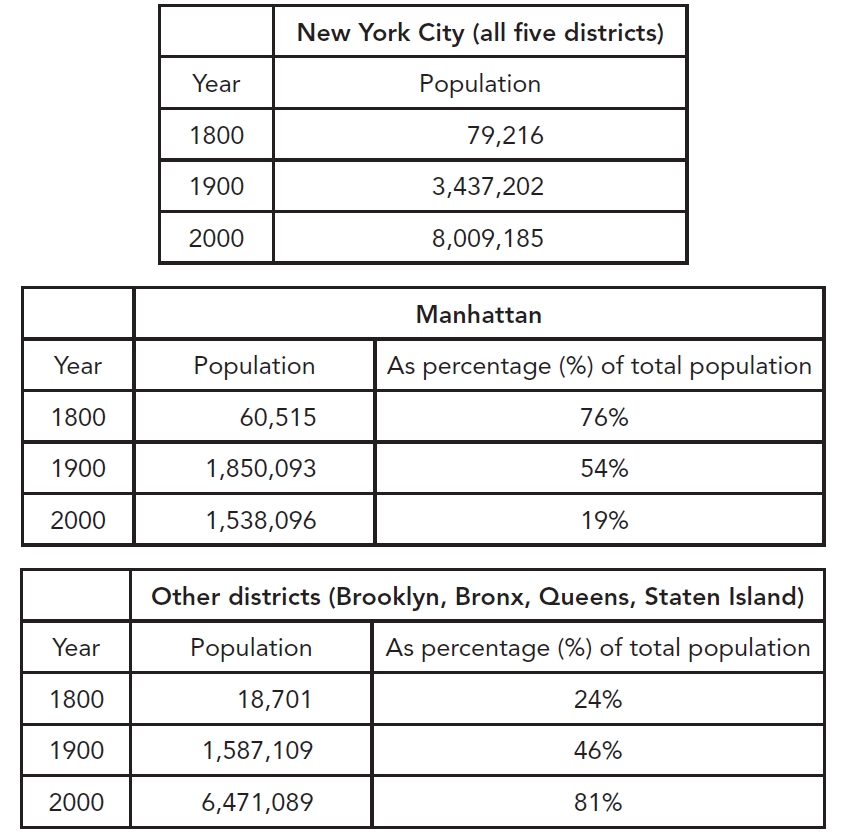
The three tables compare the population of New York City and its five districts between 1800 and 2000. Overall, the total population of New York City increased significantly over the 200-year period. Although Manhattan remained the most populated district in 1800 and 1900, its share of the city's population decreased considerably. By contrast, the other four districts accounted for a much langer proportion of the population in 2000. In 1800, New York City had a population of only 79,216 people, but this figure expanded dramatically to about 3.44 million in 1900 before reaching just over 8 million in 2000. Looking at Manhattan, its population grew from 60,515 in 1800 to around 1.85 million in 1900. However, it then fell slightly to approximately 1.54 million by 2000. As a result, the percentage of people living in Manhattan declined steadily from 76% in 1800 to 54% in 1900, before dropping sharply to only 19% in 2000. In contrast, the combined population of Brooklyn, Bronx, Queens, and Staten Island increased continously throughout the period. It rose from just 18,701 people in 1800 to around 1.59 million in 1900, before clinbing sharply to over 6.47 million in 2000. Consequently, their share of the city's total population increased from 24% to 46%, and finally reached 81% in 2000.
Detail Sampel
The first table below shows changes in the total population of New York City from 1800 to 2000. The second and third tables show changes in the population of the five districts of the city (Manhattan, Brooklyn, Bronx, Queens, Staten Island) over the same period. Summarise the information by selecting and reporting the main features, and make comparisons where relevant.
18/07/2026 16:50 7.5 skor
Topik
The first table below shows changes in the total population of New York City from 1800 to 2000. The second and third tables show changes in the population of the five districts of the city (Manhattan, Brooklyn, Bronx, Queens, Staten Island) over the same period. Summarise the information by selecting and reporting the main features, and make comparisons where relevant.
Jumlah kata: 213
Grafik/Diagram
Essay
Skor Keseluruhan
7.5±0.5
Baik
Skor Kriteria Writing
TA8.0
CC8.0
LR7.0
GRA8.0
Task Achievement8.0
Target: 7.0
Kesalahan:0
Coherence & Cohesion8.0
Target: 7.0
Kesalahan:2
Lexical Resource7.0
Target: 7.0
Kesalahan:3
Grammar & Accuracy8.0
Target: 7.0
Kesalahan:0
Klik teks yang ditandai di esai untuk melihat saran detail untuk peningkatan.
Analisis mendalam
Task 1 - Academic Writing
4 tools available
Esai contoh - IELTS Writing Task 1
Belum ada esai contoh
Silakan klik tombol di bawah untuk menganalisis dan membuat esai contoh berkualitas tinggi untuk Task 1.