
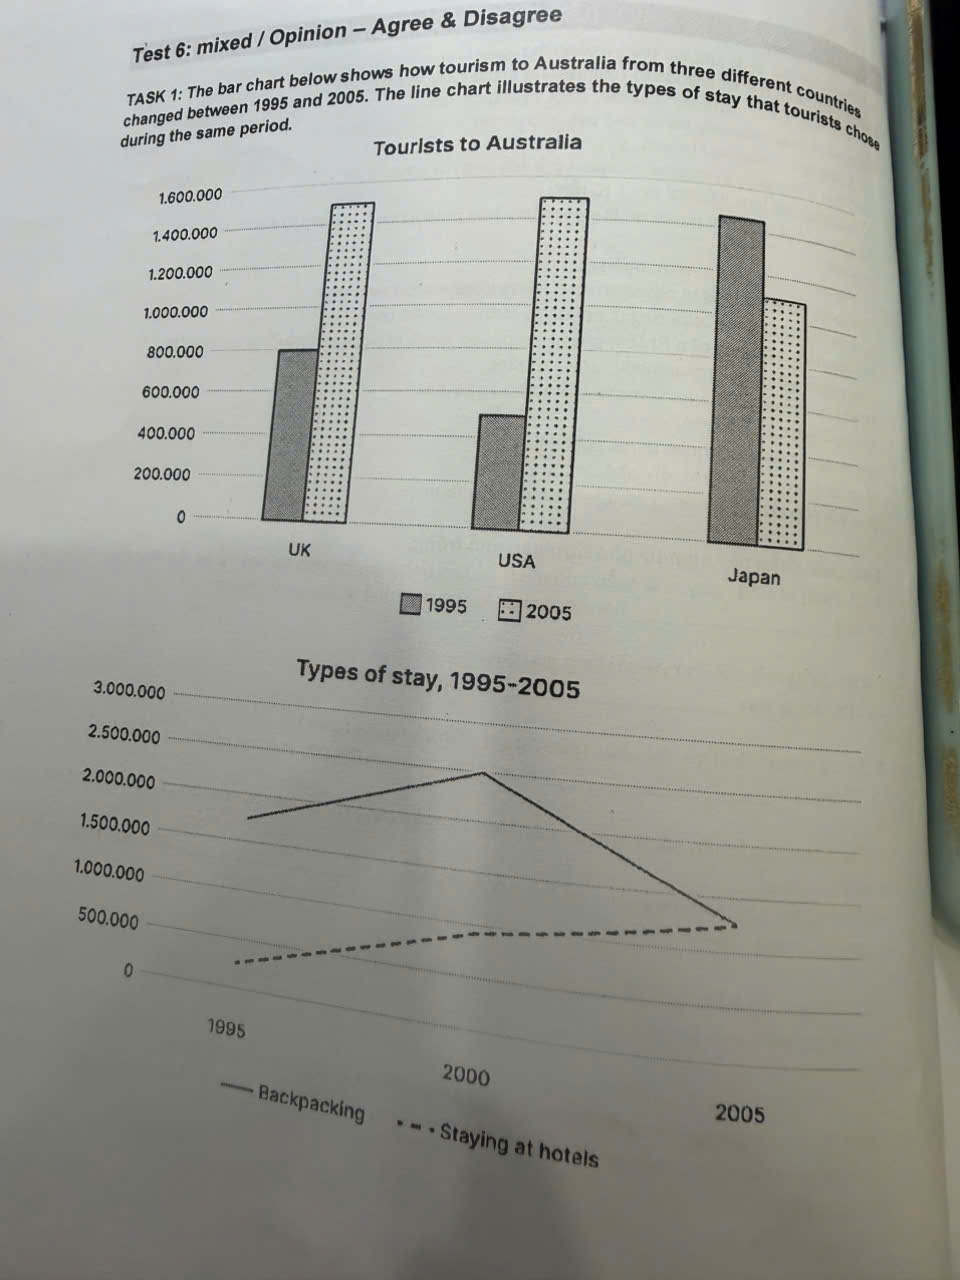
The bar chart illustrates the number of tourists travelling to Australia from UK, USA and Japan in the twenty-year period from 1995 to 2005. The line chart depicts different ways people choose to stay in during their trip. Overall, visitor numbers went to UK and USA increased significantly over the period, whereas those in Japan declined. In terms of accommodation, backpacking was the more popular option, peaking in 2000 and then falled sharply, while staying at hotels rose steadily and eventually matched backpacking number 2005. With regard to the bar chart, it can be seen that Japan contributed the largest number of visitors in 1995, at approximately 1.5 million, compared with 800 thousand in UK and around 500 thousand in USA. However, in 2005, the figures for tourists from UK and USA climbed substantially to around 1.5 million for the both. In contrast, Japan saw a dramatically decrease by around 400 thousand to just more than one million, making Japan the smallest contributor among the three nations. As for accommodation preferences, around 1.7 million of visitors chose backpacking, which was considerably higher than the 250 million who stayed in hotels. Backpacking than reached the peak of 2,5 million in 2000 before dropping significantly to around 1,25 million in 2005. In terms of staying in hotels, the figures consistently throughout the period, beginning with a modest number of 250 million in 1995, rising to about 900 million in 2000 and finally reaching the same number of packaging at approximately 1,2 million.
รายละเอียดตัวอย่าง
ASK 1: The bar chart below shows how tourism to Australia from three different countries changed between 1995 and 2005. The line chart illustrates the types of stay that tourists chose during the same period.
18/07/2026 16:56 5.5 คะแนน
หัวข้อ
ASK 1: The bar chart below shows how tourism to Australia from three different countries changed between 1995 and 2005. The line chart illustrates the types of stay that tourists chose during the same period.
จำนวนคำ: 250
แผนภูมิ/กราฟ
Essay
คะแนนรวม
5.5±0.5
พื้นฐาน
คะแนนเกณฑ์การเขียน
TA5.0
CC6.0
LR5.0
GRA6.0
Task Achievement5.0
เป้าหมาย: 7.0
ข้อผิดพลาด:9
Coherence & Cohesion6.0
เป้าหมาย: 7.0
ข้อผิดพลาด:4
Lexical Resource5.0
เป้าหมาย: 7.0
ข้อผิดพลาด:2
Grammar & Accuracy6.0
เป้าหมาย: 7.0
ข้อผิดพลาด:0
คลิกข้อความที่ไฮไลต์ในเรียงความเพื่อดูคำแนะนำรายละเอียดเพื่อพัฒนา
การวิเคราะห์เชิงลึก
Task 1 - Academic Writing
4 tools available
บทความตัวอย่าง - IELTS Writing Task 1
ยังไม่มีบทความตัวอย่าง
กดปุ่มด้านล่างเพื่อวิเคราะห์และสร้างบทความตัวอย่างคุณภาพสูงสำหรับ Task 1