
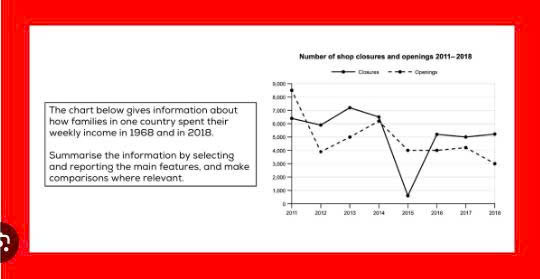
The line graph illustrates the number of shop closures and openings in one country between 2011 and 2018. Overall, the number of shop openings showed a downward trend over the period, while shop closures fluctuated considerably, reaching a low point in 2015 before recovering. In 2011, shop openings reached a peak of approximately 8,500 before falling sharply to 4,000 in 2012. The figure then recovered to around 6,000 in 2014 before declining again to 4,000 in 2015. It remained stable until 2017 and finally fell to a low of 3,000 in 2018. By contrast, shop closures stood at about 6,500 in 2011 before fluctuating between 6,000 and 7,000 until 2014. The figure then dropped dramatically to around 1,000 in 2015. After that, it rose sharply to just over 5,000 in 2016 and remained relatively stable at around 5,000 until the end of the period.
รายละเอียดตัวอย่าง
The chart shows the number of shops that closed and the number of new shops opening in a country from 2011 to 2018. Summarise the information by selecting and reporting the main features, and make comparisons where relevant.
18/07/2026 17:00 7.0 คะแนน
หัวข้อ
The chart shows the number of shops that closed and the number of new shops opening in a country from 2011 to 2018. Summarise the information by selecting and reporting the main features, and make comparisons where relevant.
จำนวนคำ: 144
แผนภูมิ/กราฟ
Essay
คะแนนรวม
7.0±0.5
ดีมาก
คะแนนเกณฑ์การเขียน
TA7.0
CC7.0
LR7.0
GRA7.0
Task Achievement7.0
เป้าหมาย: 7.0
ข้อผิดพลาด:0
Coherence & Cohesion7.0
เป้าหมาย: 7.0
ข้อผิดพลาด:3
Lexical Resource7.0
เป้าหมาย: 7.0
ข้อผิดพลาด:3
Grammar & Accuracy7.0
เป้าหมาย: 7.0
ข้อผิดพลาด:0
คลิกข้อความที่ไฮไลต์ในเรียงความเพื่อดูคำแนะนำรายละเอียดเพื่อพัฒนา
การวิเคราะห์เชิงลึก
Task 1 - Academic Writing
4 tools available
บทความตัวอย่าง - IELTS Writing Task 1
ยังไม่มีบทความตัวอย่าง
กดปุ่มด้านล่างเพื่อวิเคราะห์และสร้างบทความตัวอย่างคุณภาพสูงสำหรับ Task 1