
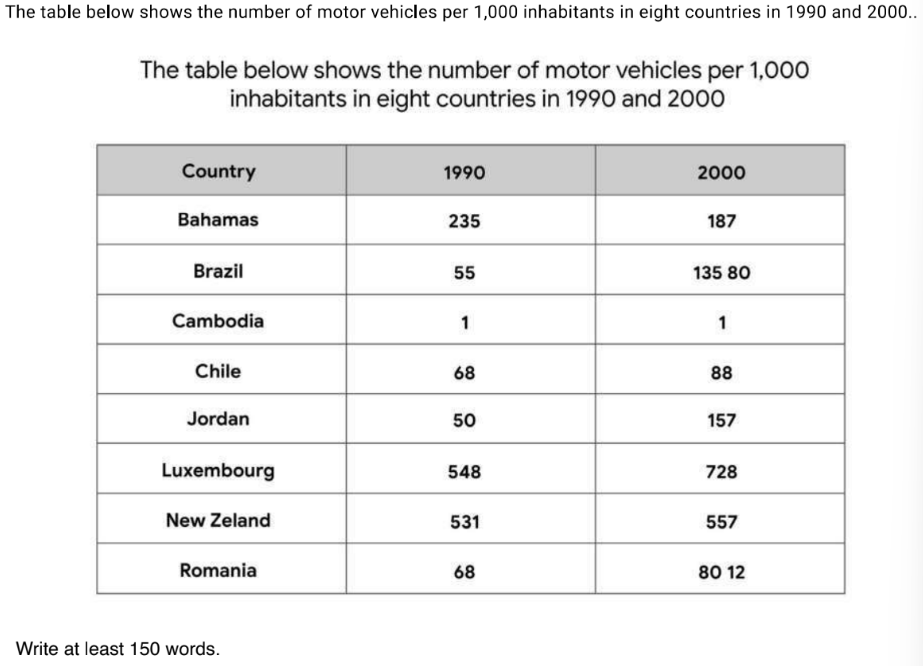
The given table provides statistical data that shows the number of motor vehicles per 1000 inhabitants in 8 countries between 1990 and 2000. The figures are given as the number of motor vehicles per 1000 inhabitants. From an overall perspective, a considerable disparity is evident. It is apparent that Luxembourg had the highest figures, while the lowest numbers were seen in Cambodia. Furthermore, while the figures for most categories experienced an upward trend, Bahamas was a notable exception, which witnessed a significant decline. Cambodia was an obvious outlier, demonstrating a consistent trend during the period. Looking at the details, Luxembourg and New Zealand were the two most prominent categories in the table. The figure for Luxembourg at 548 in 1990 rose substantially to 728 in 2000. The figure for New Zealand demonstrated an upward trajectory, commencing at 531 in 1990 and rising steadily to a peak of 557. In contrast, a significant decline was recorded for Bahamas, with its value plummeting from a high of 235 in 1990 to just 187 in 2000. Turning to the remaining regions, a different pattern can be observed. Romania and Chile started at 68 in 1990 then increased gradually to 80.12 and 88 respectively in 2000. A considerable increase was recorded for Brazil, with its value rising from 55 in 1990 to 135,80 in 2000. Jordan also had a similar pattern, starting at 50 in 1990 and to 157 in 2000. A noteworthy exception to the general trend was Cambodia, whose figures remained relatively stable, hovering around 1 mark throughout the period.
รายละเอียดตัวอย่าง
The table below shows the number of motor vehicles per 1000 inhabitants in eight countries in 1990 and 2000. Write at least 150 words.
18/07/2026 17:11 7.0 คะแนน
หัวข้อ
The table below shows the number of motor vehicles per 1000 inhabitants in eight countries in 1990 and 2000. Write at least 150 words.
จำนวนคำ: 258
แผนภูมิ/กราฟ
Essay
คะแนนรวม
7.0±0.5
ดีมาก
คะแนนเกณฑ์การเขียน
TA7.0
CC7.0
LR7.0
GRA7.0
Task Achievement7.0
เป้าหมาย: 7.0
ข้อผิดพลาด:0
Coherence & Cohesion7.0
เป้าหมาย: 7.0
ข้อผิดพลาด:3
Lexical Resource7.0
เป้าหมาย: 7.0
ข้อผิดพลาด:2
Grammar & Accuracy7.0
เป้าหมาย: 7.0
ข้อผิดพลาด:0
คลิกข้อความที่ไฮไลต์ในเรียงความเพื่อดูคำแนะนำรายละเอียดเพื่อพัฒนา
การวิเคราะห์เชิงลึก
Task 1 - Academic Writing
4 tools available
บทความตัวอย่าง - IELTS Writing Task 1
ยังไม่มีบทความตัวอย่าง
กดปุ่มด้านล่างเพื่อวิเคราะห์และสร้างบทความตัวอย่างคุณภาพสูงสำหรับ Task 1