
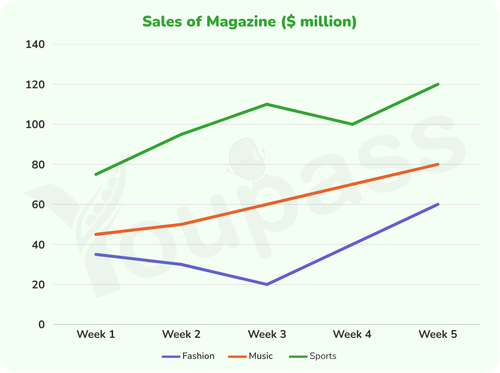
The chart demonstrates the amount of money coming from selling three categories of magazines in an area during the period of five weeks. Overall, while the figure for music experienced a consistent uptrend, that of fashion and sports fluctuated with different patterns over the period. Furthermore, the sales of sports magazines dominated the market and the fashion magazines turned out to be least bought over five weeks. Concerning the dominated figure, starting at nearly 75 million dollars, the sales of sports magazines emerged as the highest value in week 1, approximately doubling the data of fashion (35 million dollars). This figure then surged consistently for three weeks to reach 110 million dollars in week 3 before experiencing a marked fall to 100 million dollars in week 4. After that, the sports sales recovered considerably to 120 million dollars, taking the lead over the chart Regarding the less consumed categories of magazines, the figure for music started at 45 million dollars in week 1. Subsequently, it climbed progressively to 80 million dollars over the whole 5 weeks. Additionally, the sales of fashion magazines emerged as the lowest figure in week 1 (35 million dollars). The data dropped significantly to 20 million dollars in week 3, which was one fifth of sports and reached the bottom during five weeks. In the next two weeks, there was a substantial recovery of the sales of fashion magazines to 60 million dollars at the end of the period. However, it was still markedly lower than other figures, particularly being a half of sports sales
Sample Detail
The chart below shows sales of three categories of magazines (fashion, music, and sports) in a particular region over five weeks. Summarise the information by selecting and reporting the main features, and make comparisons where relevant.
18/07/2026 17:26 7.0 points
Topic
The chart below shows sales of three categories of magazines (fashion, music, and sports) in a particular region over five weeks. Summarise the information by selecting and reporting the main features, and make comparisons where relevant.
Word count: 259
Chart/Graph
Essay
Overall Scores
7.0±0.5
Good
Writing Criteria Scores
TA7.0
CC7.0
LR7.0
GRA7.0
Task Achievement7.0
Target: 7.0
Errors:1
Coherence & Cohesion7.0
Target: 7.0
Errors:2
Lexical Resource7.0
Target: 7.0
Errors:4
Grammar & Accuracy7.0
Target: 7.0
Errors:0
Click on any highlighted text in the essay to view detailed suggestions for improvement.
Deep Analysis
Task 1 - Academic Writing
4 tools available
Sample Essay - IELTS Writing Task 1
No sample essay
Click the button below to analyze and generate a high-quality sample essay for Task 1.