
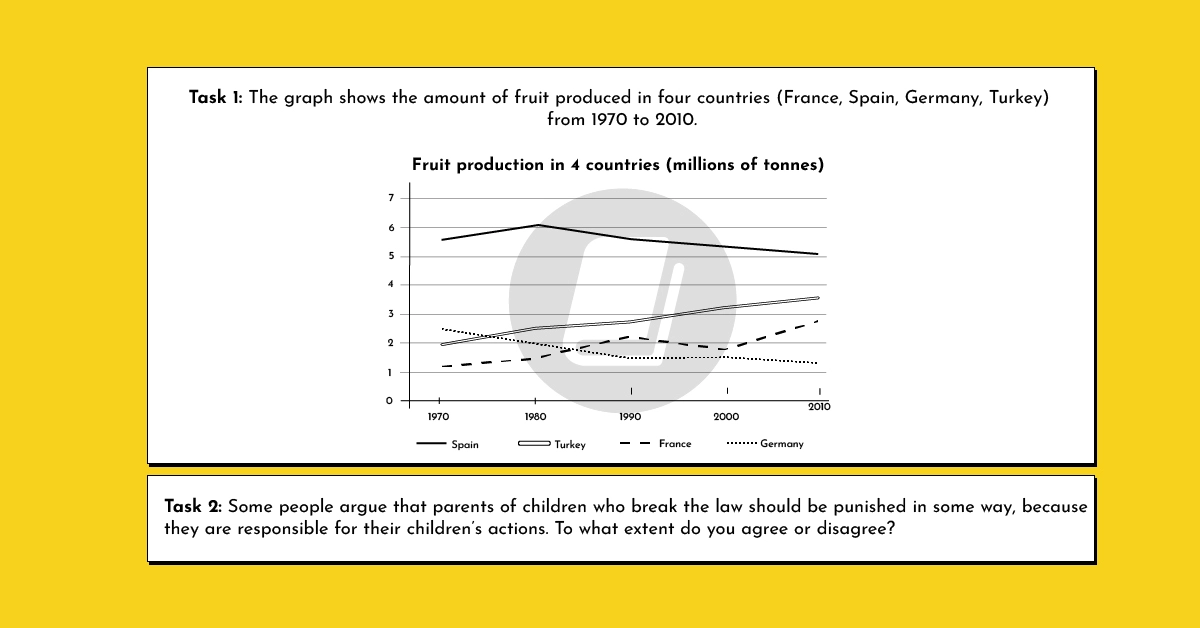
The line graph compares the fruit production, measured in millions of tonnes, in 4 different nations over a 40-year span between 1970 and 2010. Overall, while Turkey and France revealed an upward trend in fruit cultivation, Spain and Germany experienced a decline, particularly in the latter part of the timeframe. Throughout the surveyed period, Spain consistently maintained its position as a leading fruit producer among 4 countries. Regarding the countries with downward trends, in 1970, Spain produced approximately 5.7 million tonnes of fruit, far exceeding Germany's output of about 2.5 million tonnes. Subsequently, Spain's production initially peaked at 6 million tonnes in 1980, after which it gradually diminished to about 5 million tonnes by 2010. Germany, in contrast, demonstrated a more consistent decrease, falling to around 1.4 million tonnes in 1990 and declining further to finish at just over 1,2 million tonnes by the end of the period. As for the countries displaying an upward trajectory, France began with the lowest level of production in 1970, at around 1.2 million tonnes, whereas Turkey commenced slightly higher at just under 2 million tonnes. Turkey then showed remarkable and steady growth, ascending progressively from its initial figure to surpass 3.6 million tonnes in 2010, becoming the second-largest producer. Meanwhile, the data for France increased to about 2.2 million tonnes by 1990, then moderately dropped to around 1.8 million tonnes in 2000, before climbing again to nearly 2.8 million tonnes in the final year.
Detail Sampel
The graph shows the amount of fruit produced in four countries (France, Spain, Germany, Turkey) from 1970 to 2010. Summarize the information by reporting the main features, and making comparisons where relevant.
18/07/2026 17:27 7.0 skor
Topik
The graph shows the amount of fruit produced in four countries (France, Spain, Germany, Turkey) from 1970 to 2010. Summarize the information by reporting the main features, and making comparisons where relevant.
Jumlah kata: 241
Grafik/Diagram
Essay
Skor Keseluruhan
7.0±0.5
Baik
Skor Kriteria Writing
TA7.0
CC7.0
LR7.0
GRA7.0
Task Achievement7.0
Target: 7.0
Kesalahan:0
Coherence & Cohesion7.0
Target: 7.0
Kesalahan:0
Lexical Resource7.0
Target: 7.0
Kesalahan:1
Grammar & Accuracy7.0
Target: 7.0
Kesalahan:0
Klik teks yang ditandai di esai untuk melihat saran detail untuk peningkatan.
Analisis mendalam
Task 1 - Academic Writing
4 tools available
Esai contoh - IELTS Writing Task 1
Belum ada esai contoh
Silakan klik tombol di bawah untuk menganalisis dan membuat esai contoh berkualitas tinggi untuk Task 1.