
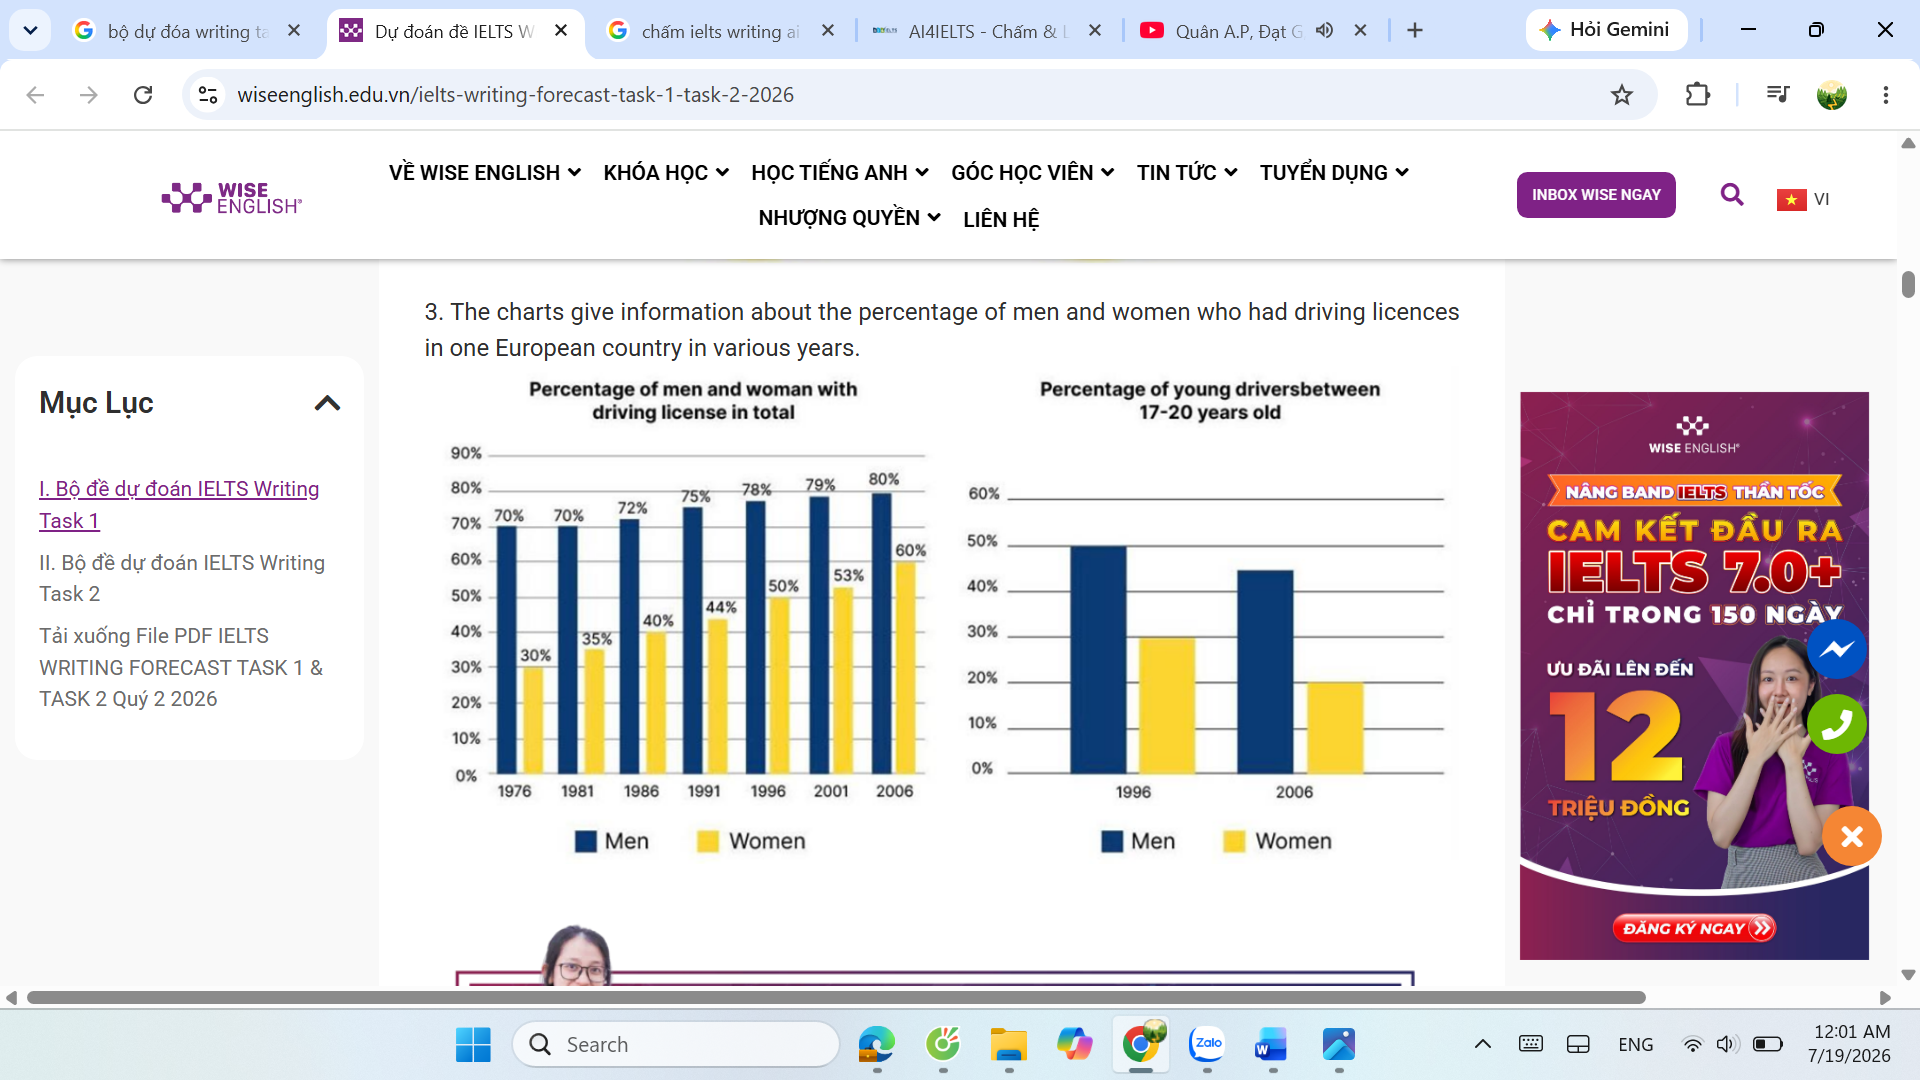
The given charts compare the proportion of people who possessed driving licenses in total in one European country from 1976 to 2006, and the percentage of young drivers aged from 17 -20 years old in 1996 and 2006. Overall, there was an upward trend in the percentage of men and women with driving licenses in total, while an opposite trend was represented in that of young people aging 17-20 years old. Notably, the figure for men in total who held the driving licenses was consistently higher that that of women. Delve in to specifics, 70% was the figure for men who gained the driving licenses, followed by that of women with 30% in 1976. After 5 years, the percentage of men remained unchanged, before increasing gradually to 80% in 2006. By contrast, the demand for women to own a tank driver’s license grew significantly to 60% in the final year. Shifting the concentration to young drivers aging from 17-20 years old, the figure for males decreased modestly from 50 % in 1996 to around 45% in 2006. A similar pattern was witnessed in the percentage of females during the same period, with 30% and 20% respectively.
รายละเอียดตัวอย่าง
the charts give information about the percentage of men and women who had driving lcenses in on European country in various years.
18/07/2026 17:36 7.0 คะแนน
หัวข้อ
the charts give information about the percentage of men and women who had driving lcenses in on European country in various years.
จำนวนคำ: 196
แผนภูมิ/กราฟ
Essay
คะแนนรวม
7.0±0.5
ดีมาก
คะแนนเกณฑ์การเขียน
TA7.0
CC7.0
LR7.0
GRA7.0
Task Achievement7.0
เป้าหมาย: 7.0
ข้อผิดพลาด:0
Coherence & Cohesion7.0
เป้าหมาย: 7.0
ข้อผิดพลาด:1
Lexical Resource7.0
เป้าหมาย: 7.0
ข้อผิดพลาด:3
Grammar & Accuracy7.0
เป้าหมาย: 7.0
ข้อผิดพลาด:0
คลิกข้อความที่ไฮไลต์ในเรียงความเพื่อดูคำแนะนำรายละเอียดเพื่อพัฒนา
การวิเคราะห์เชิงลึก
Task 1 - Academic Writing
4 tools available
บทความตัวอย่าง - IELTS Writing Task 1
ยังไม่มีบทความตัวอย่าง
กดปุ่มด้านล่างเพื่อวิเคราะห์และสร้างบทความตัวอย่างคุณภาพสูงสำหรับ Task 1