
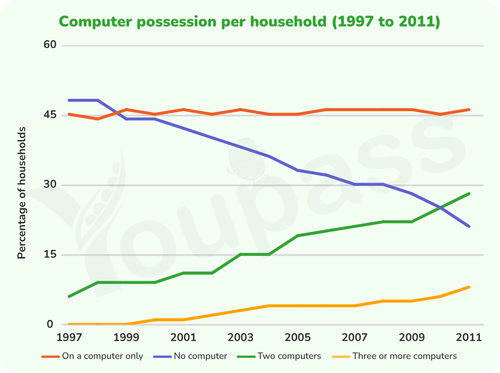
The graph illustrates one European country's computer possession by household from 1997 to 2011. Overall, two computers accelerated dramatically, and a similar pattern, but to a smaller extent, was seen in three or more computers. Meanwhile, on a computer only remained unchanged and no computer witnessed a downward trend during fourteen-year period. In general, the percentage of not owning computer was the common between 1997 and 1999 due to high costs of electric devices at that time, which was accounted for approximately 47% of households until 1998. On the other hand, the proportion of no computer was followed closely by the figure for owning one computer at nearly 45% and witnessed a slight decrease to about 44,5% in 1998. However, by 1999, the proportion of owning a computer only became more popular and rose to 46% and dominated the graph until 2011, while the figure for having no computer decreased by 27% from 1999 to 2011. A contrasting trend was seen in the percentage of owning two computers and three or more computers. In 1997, two computers represented a mere 10% of households, and three or more computers represented a zero. From 1997 to 1999, three or more computers remained being unchanged and finally witnessed a slight increase in 1999 at approximately 2%. . However, two computers saw a significant increase between 1999 to 2011, the figure for no computer and two computers were identical, both standing at nearly 25% in 2010. By 2011, the proportion of two computers came at a distant second at 28%, outpacing three or more computers by a margin of 18%.
Sample Detail
The graph below gives information about computer possession by household in one European country between 1997 and 2011. Summarise the information by selecting and reporting the main features, and make comparisons where relevant.
18/07/2026 17:59 6.0 points
Topic
The graph below gives information about computer possession by household in one European country between 1997 and 2011. Summarise the information by selecting and reporting the main features, and make comparisons where relevant.
Word count: 266
Chart/Graph
Essay
Overall Scores
6.0±0.5
Fair
Writing Criteria Scores
TA6.0
CC7.0
LR6.0
GRA6.0
Task Achievement6.0
Target: 7.0
Errors:1
Coherence & Cohesion7.0
Target: 7.0
Errors:1
Lexical Resource6.0
Target: 7.0
Errors:4
Grammar & Accuracy6.0
Target: 7.0
Errors:0
Click on any highlighted text in the essay to view detailed suggestions for improvement.
Deep Analysis
Task 1 - Academic Writing
4 tools available
Sample Essay - IELTS Writing Task 1
No sample essay
Click the button below to analyze and generate a high-quality sample essay for Task 1.