
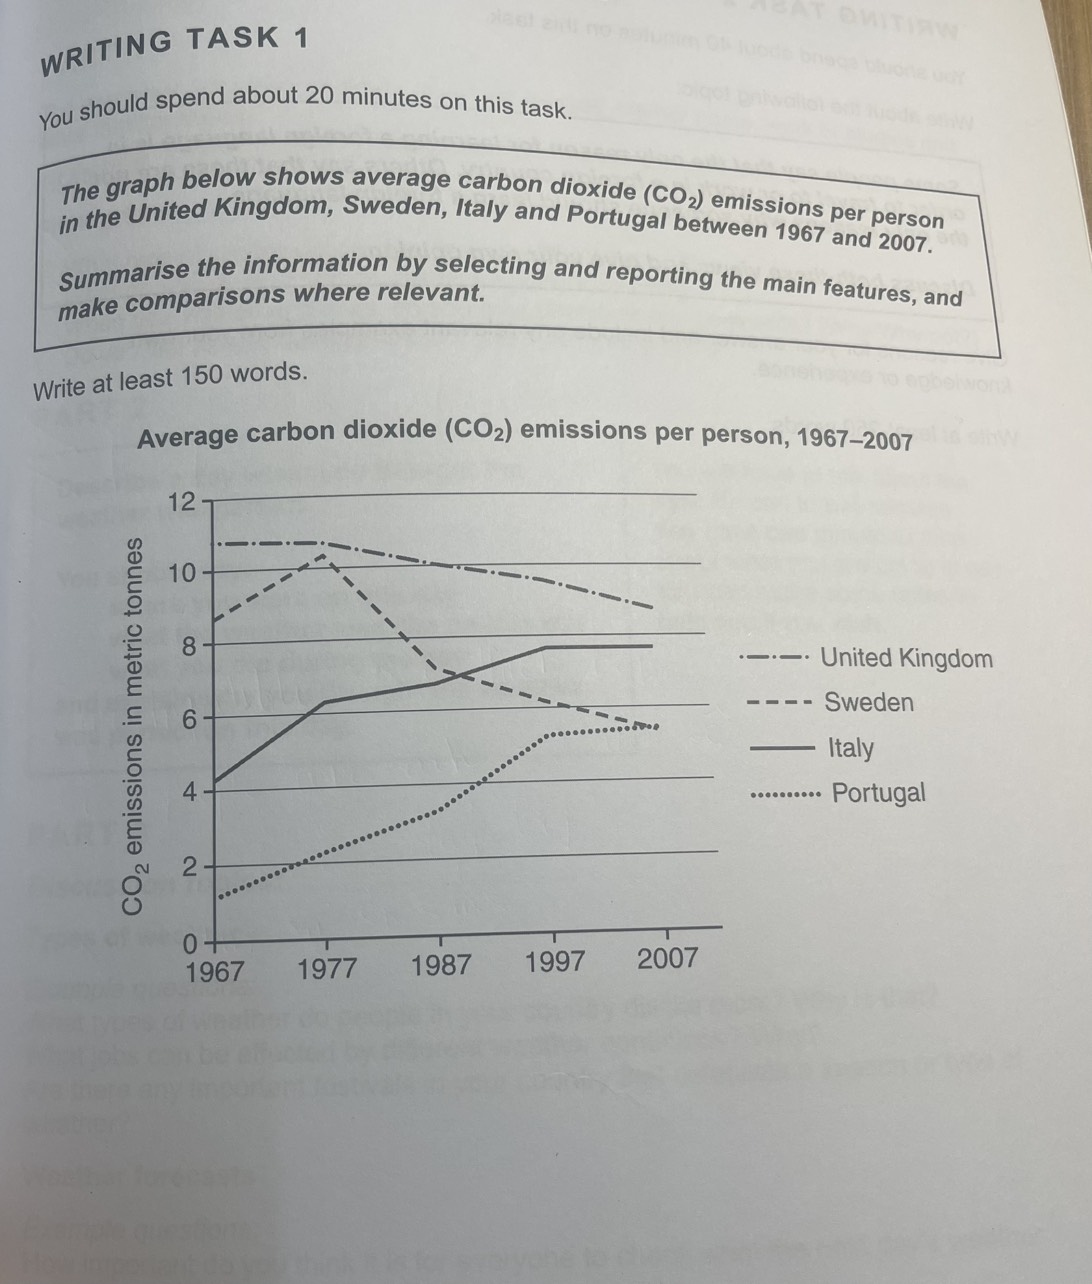
The graph illustrates the average of dioxide emissions per person in four European nations from 1967 to 2007. From an overall perspective, it is clear that average CO2 in Italy and Portugal showed an upward trend, whereas a reserve pattern could be observed in the figures for United Kingdom and Sweden. The average carbon dioxide used per person in the UK was the highest, at over 10 metric tonnes in 1967. Howerver, this data witnessed a sharp decrease from about 11 metric tonnes in 1977 to approximately 9 metric tonnes in the end of the period. Sweden's data declined seemed to follow a rather similar path, were almost 9 metric tonnes in 1967, then increased to around 10 metric tonnes in 1977 from there, emissions continuously fell to nearly 6 metric tonnes in 2007. In contrast, the data on Italy and Portugal climbed rapidly between 1967 and 2007. Italy's CO2 emissions staring at above 4 metric tonnes, which is twice as much as Portugal at under 2 metric tonnes in 1967. Although these figures lower than two other countries initially, but then had a sigificant increase to nearly 8 metric tonnes and 6 metric tonnes in 2007, respectively.
รายละเอียดตัวอย่าง
The graph below shows awerene carbon dioxide (CO,) emissions per person in the United Kingdom, Sweden, Italy and Portugal between 1967 and 2087. Summarise the information by selecting and reporting the main features, and make comparisons where relevant. Write at least 150 words.
18/07/2026 18:13 6.5 คะแนน
หัวข้อ
The graph below shows awerene carbon dioxide (CO,) emissions per person in the United Kingdom, Sweden, Italy and Portugal between 1967 and 2087. Summarise the information by selecting and reporting the main features, and make comparisons where relevant. Write at least 150 words.
จำนวนคำ: 198
แผนภูมิ/กราฟ
Essay
คะแนนรวม
6.5±0.5
ดีพอใช้
คะแนนเกณฑ์การเขียน
TA7.0
CC7.0
LR6.0
GRA7.0
Task Achievement7.0
เป้าหมาย: 7.0
ข้อผิดพลาด:0
Coherence & Cohesion7.0
เป้าหมาย: 7.0
ข้อผิดพลาด:2
Lexical Resource6.0
เป้าหมาย: 7.0
ข้อผิดพลาด:4
Grammar & Accuracy7.0
เป้าหมาย: 7.0
ข้อผิดพลาด:0
คลิกข้อความที่ไฮไลต์ในเรียงความเพื่อดูคำแนะนำรายละเอียดเพื่อพัฒนา
การวิเคราะห์เชิงลึก
Task 1 - Academic Writing
4 tools available
บทความตัวอย่าง - IELTS Writing Task 1
ยังไม่มีบทความตัวอย่าง
กดปุ่มด้านล่างเพื่อวิเคราะห์และสร้างบทความตัวอย่างคุณภาพสูงสำหรับ Task 1