
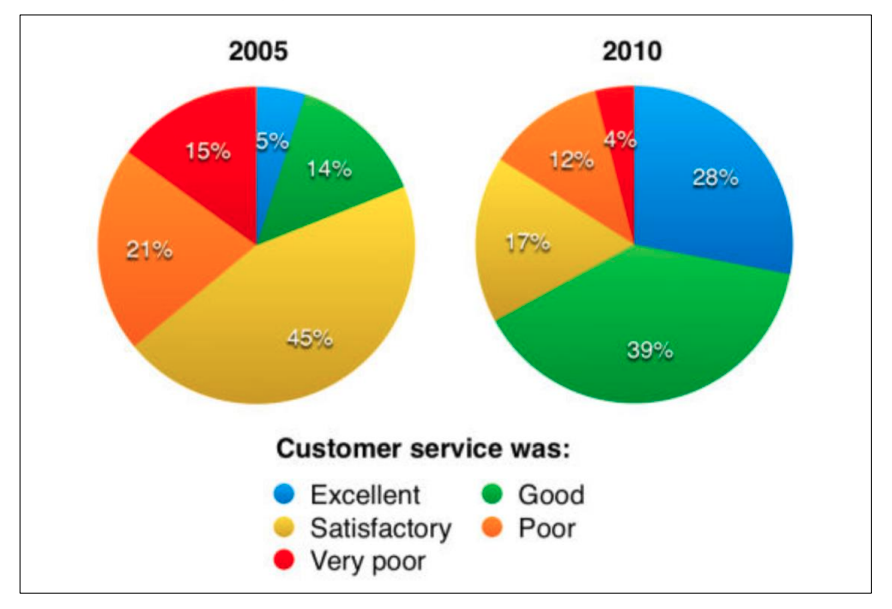
The two pie charts compare and illustrate the proportion of customer service evaluation in Parkway Hotel in 2005 and 2010. Overall, most visitors said that it was satisfactory. However, it decreased over the five-year period, and the same for most of them. Upon initial observation, we will observe that in 2005, the main reason behind the success of the hotel was the satisfaction way of welcoming, comprising 45%, which made it the leading category. Followed by poor, with 21% of the percentage, respectively. Very poor and good accounted for 15% and 14%, while excellent made up a mere 5%. Turning to 2010, it can be seen that good hospitality saw a dramatic rise, increasing to 39%. In contrast, satisfactory had a scary decline, falling to 17%. Followed by poor and very poor, with 12% and 4%, respectively. Meanwhile, the hotel did an excellent job, by increasing to 28%, making it the second cause of the success.
नमूना विवरण
The charts below show the results of a questionnaire that asked visitors to the Parkway Hotel how they rated the hotel’s customer service. The same questionnaire was given to 100 guests in the years 2005 and 2010.
18/07/2026 18:44 6.5 अंक
विषय
The charts below show the results of a questionnaire that asked visitors to the Parkway Hotel how they rated the hotel’s customer service. The same questionnaire was given to 100 guests in the years 2005 and 2010.
शब्दों की संख्या: 156
चार्ट/ग्राफ
Essay
समग्र स्कोर
6.5±0.5
ठीक
राइटिंग मानदंड स्कोर
TA6.0
CC7.0
LR7.0
GRA7.0
Task Achievement6.0
लक्ष्य: 7.0
त्रुटियां:3
Coherence & Cohesion7.0
लक्ष्य: 7.0
त्रुटियां:1
Lexical Resource7.0
लक्ष्य: 7.0
त्रुटियां:6
Grammar & Accuracy7.0
लक्ष्य: 7.0
त्रुटियां:0
सुधार के विस्तृत सुझाव देखने के लिए लेख में किसी भी हाइलाइट किए गए टेक्स्ट पर क्लिक करें।
गहन विश्लेषण
Task 1 - Academic Writing
4 उपकरण उपलब्ध
नमूना लेख - IELTS Writing Task 1
कोई नमूना लेख नहीं
Task 1 के लिए उच्च-गुणवत्ता वाला नमूना लेख विश्लेषण और बनाने के लिए नीचे दिए गए बटन पर क्लिक करें।