
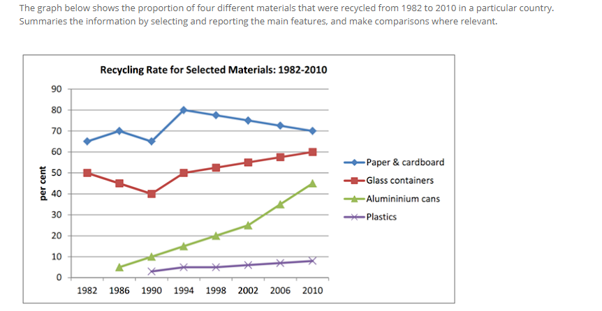
The line chart compares the percentage of various waste products by materials from 1982 to 2010. Overall, it can be seen that all of categories followed an upward trend and none of their changes was larger than Alumininium cans. Additionally, Paper & cardboard always held the highest position for recycling materials in contrast to Plastics being the most unsustainable cohort over the course of 29 years. Regarding the dominant group, Paper and cardboard constituted the highest share at the beginning of the period at around 65 percent, and then witnessed a moderate rise to hit a high of 80 percent among the four despite some fluctuations. Afterwards, they gradually dropped by 10 percent to close out the timeframe, remaining the position for being the most recyclable type of materials over the period. Similarly, Glass containers were second in line after Paper & cardboard in 1982. From this point, there was a temporary descend in the percentage of Glass containers recycled to bottom at 40 percent, prior to a remarkable upsurge in pace towards the end to 60 percent. Concerning the remaining two types, Alumininium cans were not introduced until the year of 1986, when they started to soar to finish the period with the proportion of more than 40 percent, which was 9 times as high as at the beginning. A similar pattern was seen in the rate in Plastics. Having appeared in 1990, this figure recorded a minimal growth of under 10 percent by 2010, which was the lowest increase of all categories in question.
Sample Detail
The graph below shows the proportions of four different materials that were recycled from 1982 to 2010 in a particular country.
18/07/2026 18:52 7.0 points
Topic
The graph below shows the proportions of four different materials that were recycled from 1982 to 2010 in a particular country.
Word count: 256
Chart/Graph
Essay
Overall Scores
7.0±0.5
Good
Writing Criteria Scores
TA7.0
CC7.0
LR7.0
GRA7.0
Task Achievement7.0
Target: 7.0
Errors:2
Coherence & Cohesion7.0
Target: 7.0
Errors:2
Lexical Resource7.0
Target: 7.0
Errors:8
Grammar & Accuracy7.0
Target: 7.0
Errors:0
Click on any highlighted text in the essay to view detailed suggestions for improvement.
Deep Analysis
Task 1 - Academic Writing
4 tools available
Sample Essay - IELTS Writing Task 1
No sample essay
Click the button below to analyze and generate a high-quality sample essay for Task 1.