
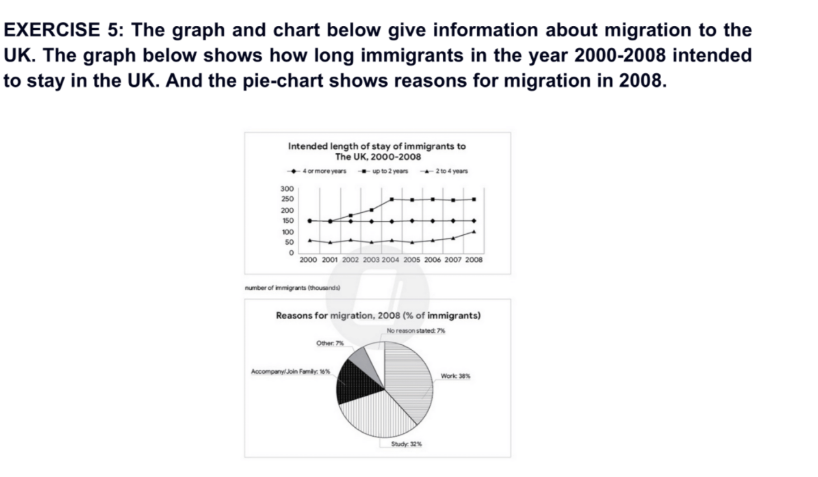
The line graph illustrates the intended length of stay of immigrants to the UK between 2000 and 2008, while the pie chart depicts the reasons for migration in 2008. Overall, it is evident that immigrants intending to stay for up to two years were the largest group throughout the period, whereas those staying for 2 to 4 years were consistently the smallest group. Moreover, work was the largest reason for migration in the UK in 2008. In 2000, the numbers of immigrants intending to stay for up to two years and for four or more years were equal at 150 thousand. From 2001 onwards, however, the figure for those planning to stay for up to two years increased considerably, peaking at 250 thousand in 2004. Meanwhile, the figure for immigrants planning to stay for four or more years rose slightly during the first half of the period before declining gradually to around 150 thousand by 2008. By contrast, the figure for immigrants intending to stay for two to four years remained the lowest throughout the period, fluctuating around 50 thousand before rising to approximately 100 thousand in 2008. Turning to the pie chart, work accounted for the largest share at roughly 38%. This was closely followed by study at 32%, making it the second-largest reason. Accompanying or joining family was the third most common reason, representing approximately 16%. Lastly, other and no reason stated each accounted for 7%.
Detail Sampel
The graph and chart below give information about migration to the UK. The graph below shows how long immigrants in the year 2000–2008 intended to stay in the UK. The pie chart shows reasons for migration in 2008.
18/07/2026 19:24 7.5 skor
Topik
The graph and chart below give information about migration to the UK. The graph below shows how long immigrants in the year 2000–2008 intended to stay in the UK. The pie chart shows reasons for migration in 2008.
Jumlah kata: 238
Grafik/Diagram
Essay
Skor Keseluruhan
7.5±0.5
Baik
Skor Kriteria Writing
TA7.0
CC8.0
LR8.0
GRA8.0
Task Achievement7.0
Target: 7.0
Kesalahan:0
Coherence & Cohesion8.0
Target: 7.0
Kesalahan:1
Lexical Resource8.0
Target: 7.0
Kesalahan:1
Grammar & Accuracy8.0
Target: 7.0
Kesalahan:0
Klik teks yang ditandai di esai untuk melihat saran detail untuk peningkatan.
Analisis mendalam
Task 1 - Academic Writing
4 tools available
Esai contoh - IELTS Writing Task 1
Belum ada esai contoh
Silakan klik tombol di bawah untuk menganalisis dan membuat esai contoh berkualitas tinggi untuk Task 1.