
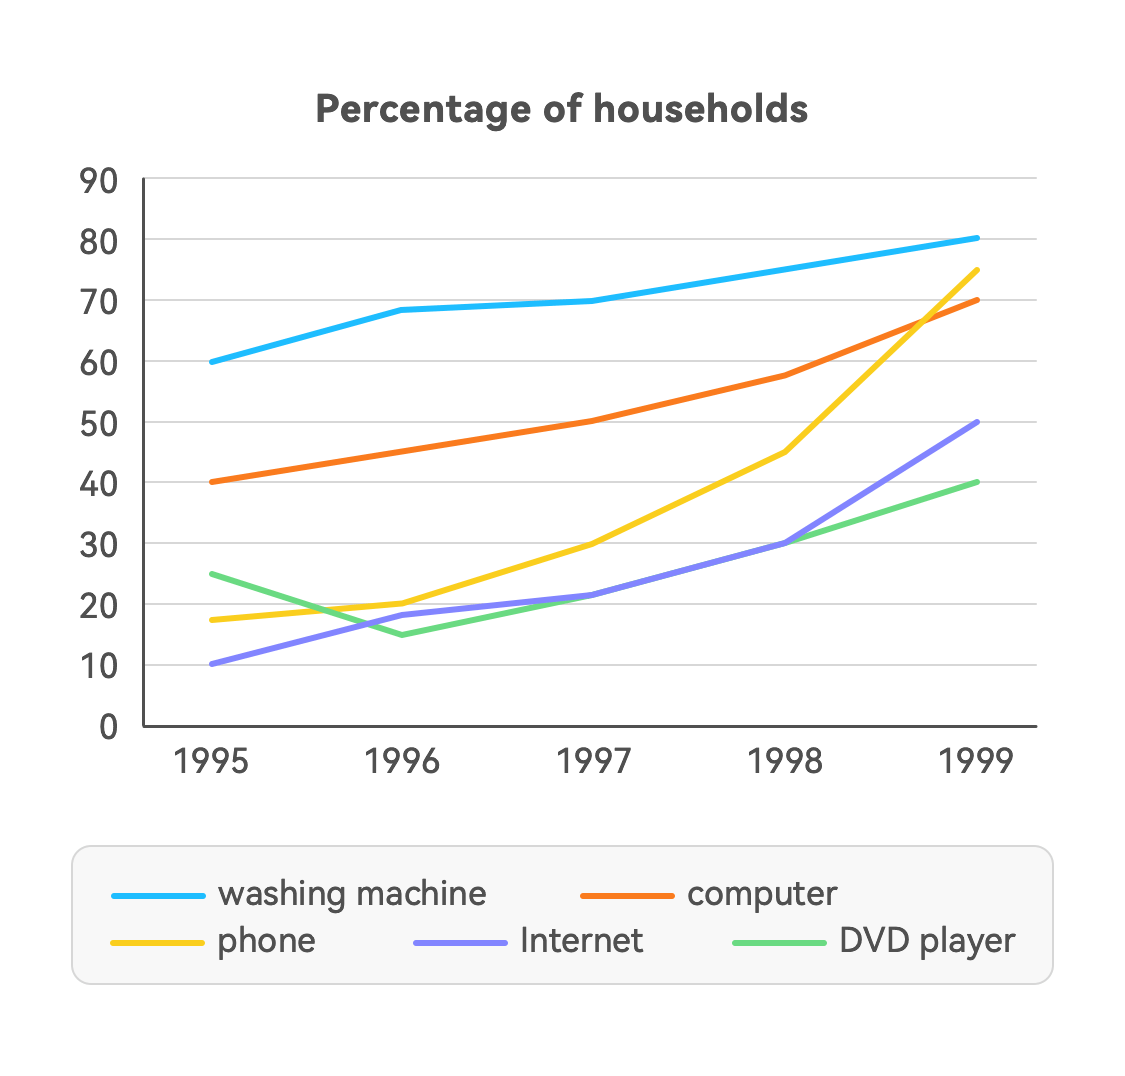
The given graph illustrates between 1995 and 1999, what is the percentage of households with 5 different types of device in America. Overall, we can clearly see that the amount of possession with these technologies are increased over the period. Remarkably, washing machine was the most owned among the list. In 1995, 60% of the households had a washing machine in their house, which was 6 times compare with the figure for internet. Computer started at 40%, while the proportion of households with dvd player and phones was around 25% and 19% respectively. In the next four years, washing machine still held the first place and even increased its percentage slightly by 20%. At the same time, phone became more popular and the figure for phone rocketed to 60% while computer was just less than a few percent. Even though started with a higher proportion, dvd player remained at the lowest place with just about 40% which is four-fifths compare with the internet.
नमूना विवरण
The graph below shows the percentage of households with different kinds of technology in the U.S. from 1995 to 1999. Summarize the information by selecting and reporting the main features, and make comparisons where relevant. Write at least 150 words.
19/07/2026 00:53 5.0 अंक
विषय
The graph below shows the percentage of households with different kinds of technology in the U.S. from 1995 to 1999. Summarize the information by selecting and reporting the main features, and make comparisons where relevant. Write at least 150 words.
शब्दों की संख्या: 163
चार्ट/ग्राफ
Essay
समग्र स्कोर
5.0±0.5
बुनियादी
राइटिंग मानदंड स्कोर
TA5.0
CC5.0
LR5.0
GRA5.0
Task Achievement5.0
लक्ष्य: 7.0
त्रुटियां:2
Coherence & Cohesion5.0
लक्ष्य: 7.0
त्रुटियां:4
Lexical Resource5.0
लक्ष्य: 7.0
त्रुटियां:16
Grammar & Accuracy5.0
लक्ष्य: 7.0
त्रुटियां:0
सुधार के विस्तृत सुझाव देखने के लिए लेख में किसी भी हाइलाइट किए गए टेक्स्ट पर क्लिक करें।
गहन विश्लेषण
Task 1 - Academic Writing
4 उपकरण उपलब्ध
नमूना लेख - IELTS Writing Task 1
कोई नमूना लेख नहीं
Task 1 के लिए उच्च-गुणवत्ता वाला नमूना लेख विश्लेषण और बनाने के लिए नीचे दिए गए बटन पर क्लिक करें।