
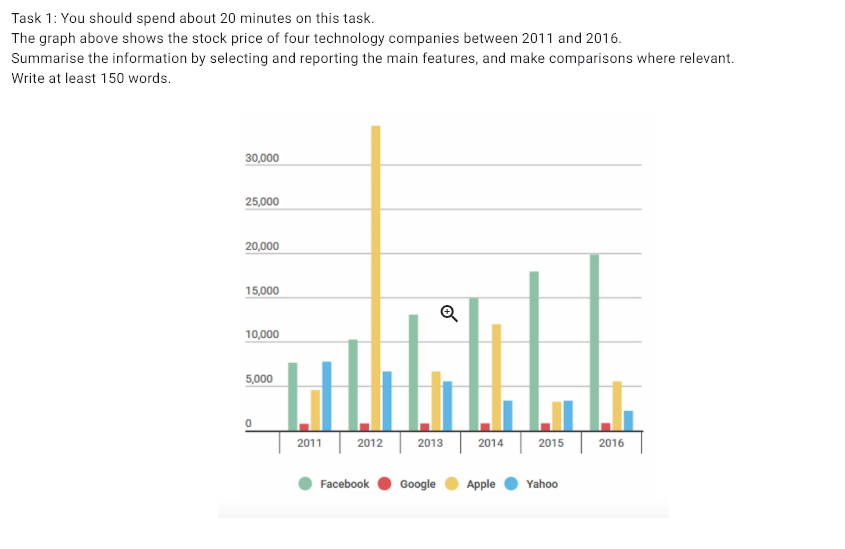
The bar graph illustrates how the stock prices of four technology companies from 2011 to 2016. Overall, Facebook, Apple, and Yahoo had a movement trend, while Google remained unchanged. In addition, the stock price of Facebook topped the list, except Apple surpassed it in 2012. In terms of Facebook, a moderate increase was recorded from 7500 in 2011 to 20000 in 2016, representing a rise of a half of 12 millions . Meanwhile, Apple experienced a noticeble fluctuation throughout this period. This was fewer than 5000 in 2011, before peaking at more than 30 millions in 2012, topped the list in this year, with a subsequent dropping to more 5 millions in the final year Regarding the remaining technology companies, Yahoo showed a general fell. It was 7500 at the starting year, followed by a small declining to fewer than 5 millions in 2014, remaining unchanged in 2015, but later falled to 2500 in 2016. In contract, the stock price of Google recorded a levelling off 2000. This amount became the lowest During the period.
รายละเอียดตัวอย่าง
the graph above shows the stock price of four technology companies between 2011 and 2016
19/07/2026 00:58 5.5 คะแนน
หัวข้อ
the graph above shows the stock price of four technology companies between 2011 and 2016
จำนวนคำ: 175
แผนภูมิ/กราฟ
Essay
คะแนนรวม
5.5±0.5
พื้นฐาน
คะแนนเกณฑ์การเขียน
TA5.0
CC6.0
LR5.0
GRA6.0
Task Achievement5.0
เป้าหมาย: 7.0
ข้อผิดพลาด:2
Coherence & Cohesion6.0
เป้าหมาย: 7.0
ข้อผิดพลาด:1
Lexical Resource5.0
เป้าหมาย: 7.0
ข้อผิดพลาด:2
Grammar & Accuracy6.0
เป้าหมาย: 7.0
ข้อผิดพลาด:0
คลิกข้อความที่ไฮไลต์ในเรียงความเพื่อดูคำแนะนำรายละเอียดเพื่อพัฒนา
การวิเคราะห์เชิงลึก
Task 1 - Academic Writing
4 tools available
บทความตัวอย่าง - IELTS Writing Task 1
ยังไม่มีบทความตัวอย่าง
กดปุ่มด้านล่างเพื่อวิเคราะห์และสร้างบทความตัวอย่างคุณภาพสูงสำหรับ Task 1