
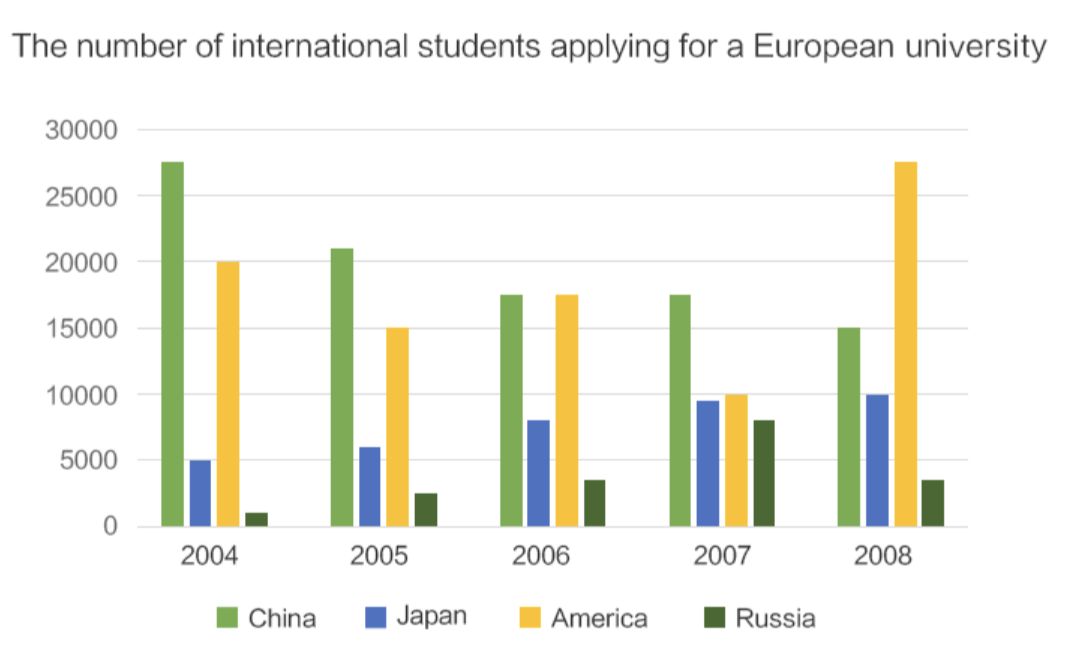
The bar chart illustrates the figures for international applicants of universities in a European country. Overall, it is obvious that the upward trend was registered in Japan. Moreover, all other countries witnessed a considerable fluctuation over the period. Looking more closely at the given chart, with two Asian countries, there is a huge difference. The quantity of learners applying from China decreased from around 27500 in to 15000 at the end of the period. By contrast, there is a steady growth in Japan’s figure through the years, from 5000 applicants to 10000 applicants, which was two times higher than the initial level. Regarding two remaining countries, the number of American students applying to the universities of a European country fluctuated significantly between 10000 applicants and 20000 applicants. At the end of the period, America’s figure reached a peak of nearly 29000. Starting at just approximately 1000 applicants during the first year of the period, Russia's figure rose to about 7000 applicants in 2007. Nevertheless, this figure dropped to around 4000, which was the same as applicants in 2006 and the lowest among the four countries.
Sample Detail
The chart below shows the number of international applicants to the universities of one European country.
19/07/2026 05:25 6.0 points
Topic
The chart below shows the number of international applicants to the universities of one European country.
Word count: 185
Chart/Graph
Essay
Overall Scores
6.0±0.5
Fair
Writing Criteria Scores
TA6.0
CC7.0
LR6.0
GRA6.0
Task Achievement6.0
Target: 7.0
Errors:1
Coherence & Cohesion7.0
Target: 7.0
Errors:3
Lexical Resource6.0
Target: 7.0
Errors:2
Grammar & Accuracy6.0
Target: 7.0
Errors:0
Click on any highlighted text in the essay to view detailed suggestions for improvement.
Deep Analysis
Task 1 - Academic Writing
4 tools available
Sample Essay - IELTS Writing Task 1
No sample essay
Click the button below to analyze and generate a high-quality sample essay for Task 1.