
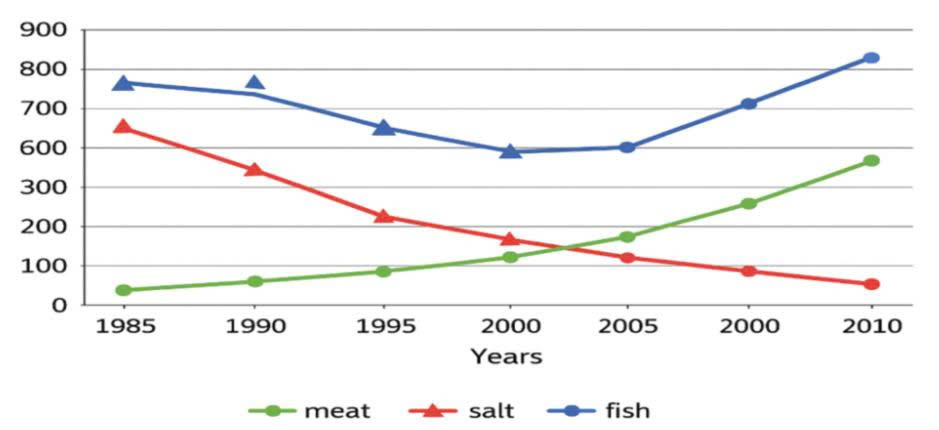
The line graph depicts the distribution of food to citizen Chinese from 1985 to 2010. Overall, it is clear that spending on salt witnessed a downward trend, while the opposite was true for meat. Additionally, spending on fish recorded the highest “ consumption “ Food consumption showed an upward and recovering trend. Fish consumption reached the highest point of about 750 in 1985 and decreased gradually to around 580 by 2000, then it rose fastly to over 800 in 2010. Meat consumption started at a low level about 40 in 1985 . Next, it increased gradually to more than 100 in 2000 and continued to increase yearly, ending at about 580 in 2010. In contrast, salt consumption reached a highest point of about 650 in 1985, then it decreased slowly to about 170 in 2000 and it bottomed at around 30 in 2010, becoming the least food consumption.
Detail Sampel
The graph below shows the changes in food consumption by Chinese people between 1985 and 2010.
19/07/2026 05:31 5.5 skor
Topik
The graph below shows the changes in food consumption by Chinese people between 1985 and 2010.
Jumlah kata: 148
Grafik/Diagram
Essay
Skor Keseluruhan
5.5±0.5
Dasar
Skor Kriteria Writing
TA6.0
CC6.0
LR5.0
GRA6.0
Task Achievement6.0
Target: 7.0
Kesalahan:1
Coherence & Cohesion6.0
Target: 7.0
Kesalahan:10
Lexical Resource5.0
Target: 7.0
Kesalahan:11
Grammar & Accuracy6.0
Target: 7.0
Kesalahan:0
Klik teks yang ditandai di esai untuk melihat saran detail untuk peningkatan.
Analisis mendalam
Task 1 - Academic Writing
4 tools available
Esai contoh - IELTS Writing Task 1
Belum ada esai contoh
Silakan klik tombol di bawah untuk menganalisis dan membuat esai contoh berkualitas tinggi untuk Task 1.